Did you know that nearly 1 in 3 college students do not graduate at all?
Between you and a couple of your friends entering college for the first time as freshmen students, you could be that person who is likely to fail to earn a bachelor’s degree!
Whether you are planning on attending a community college or a 4-year institution or whether you are thinking about attending grad school after your undergraduate studies or heading straight to the workforce armed with a BS in engineering or computer science – there are things you need to know that you might not find by visiting US News or the College Board.
In this article, you will find 199 facts and statistics about colleges in the US, most of which are shocking and unbelievable — and you might even come across them for the very first time here!
From student loans and Greek life to campus violence, you will run into data and figures you have to know to avoid becoming like a deer in the headlights once you are already an undergraduate student.
Let’s begin!
Student Debt and Loan Repayment Statistics
Student loan debt refers to the amount of money college students owe the federal government or private lenders for borrowing for their educational needs.
Unlike scholarships and grants, student loans need to be paid back with interest.
Many individuals with some college experience but no degree and with degree alike struggle for years to repay their student loans.
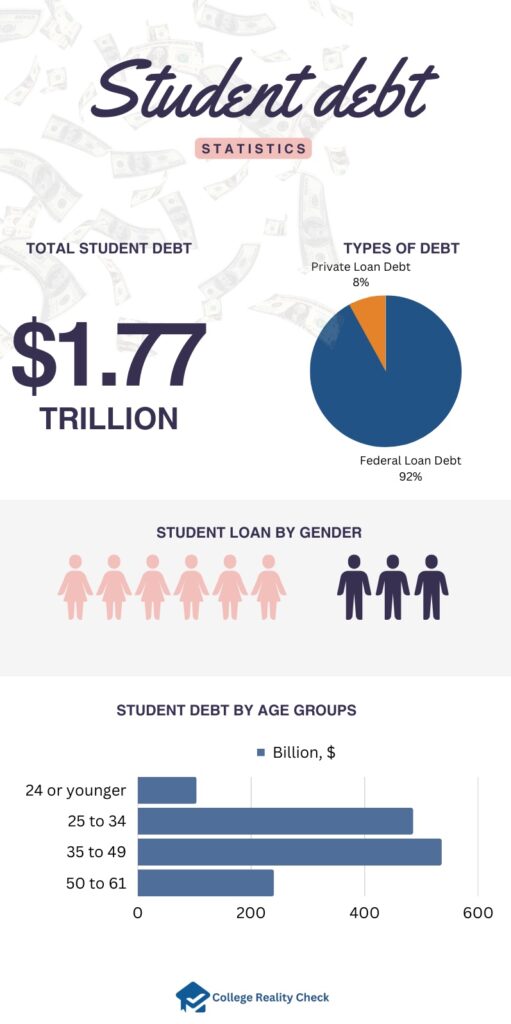
- USA Today reports that, according to Federal Student Aid, which is an office of the US Department of Education and the largest provider of student financial aid in the country, student loan debt in the US stands at a total of more than $1.77 trillion as of the first quarter of this year.
- It adds that over 92% of the said amount is federal student loan debt — the rest is private loan debt.
- Meanwhile, based on the findings of Trends in College Pricing and Student Aid by the College Board, as of March of last year, around 33% of all borrowers owed less than $10,000, while about 21% of borrowers owed between $10,000 and $20,000 in federal student loan debt.
- The amount of money students have to pay off varies by age group.
- For instance, according to Federal Student Aid, individuals aged 35 to 49 (12.1 million borrowers) owe $535.2 billion.
- Those who are between 25 to 34 years old (14.8 million borrowers), meanwhile, owe $484.8 billion.
- People aged 50 to 61 (5 million borrowers) owe $239.5 billion, while those who are 24 years of age and younger (7.1 million borrowers) owe $103.2 billion.
- According to the American Association of University Women, generally speaking, women borrow more money for their educational needs than men — they hold almost two-thirds of the entire student loan debt in the US.
- It adds that women who earn a bachelor’s degree owe, on average, $2,700 more than men upon graduation.
- The following figures demonstrate student loan debts between men and women, further broken down by race or ethnicity:
- White ($29,862 vs. $31,346)
- Black ($35,665 vs. $37,558)
- Hispanic or Latino ($27,452 vs. $27,029)
- Asian ($25,507 vs. $25,252).
College Tuition Statistics
Tuition refers to the fees charged by academic institutions for academic instruction and various related services.
Typically, tuition is the single most expensive cost of attending college, usually followed by room and board for students living on campus.
How much tuition students pay depends on factors such as the number of credits they take and the financial aid they qualify for per year.
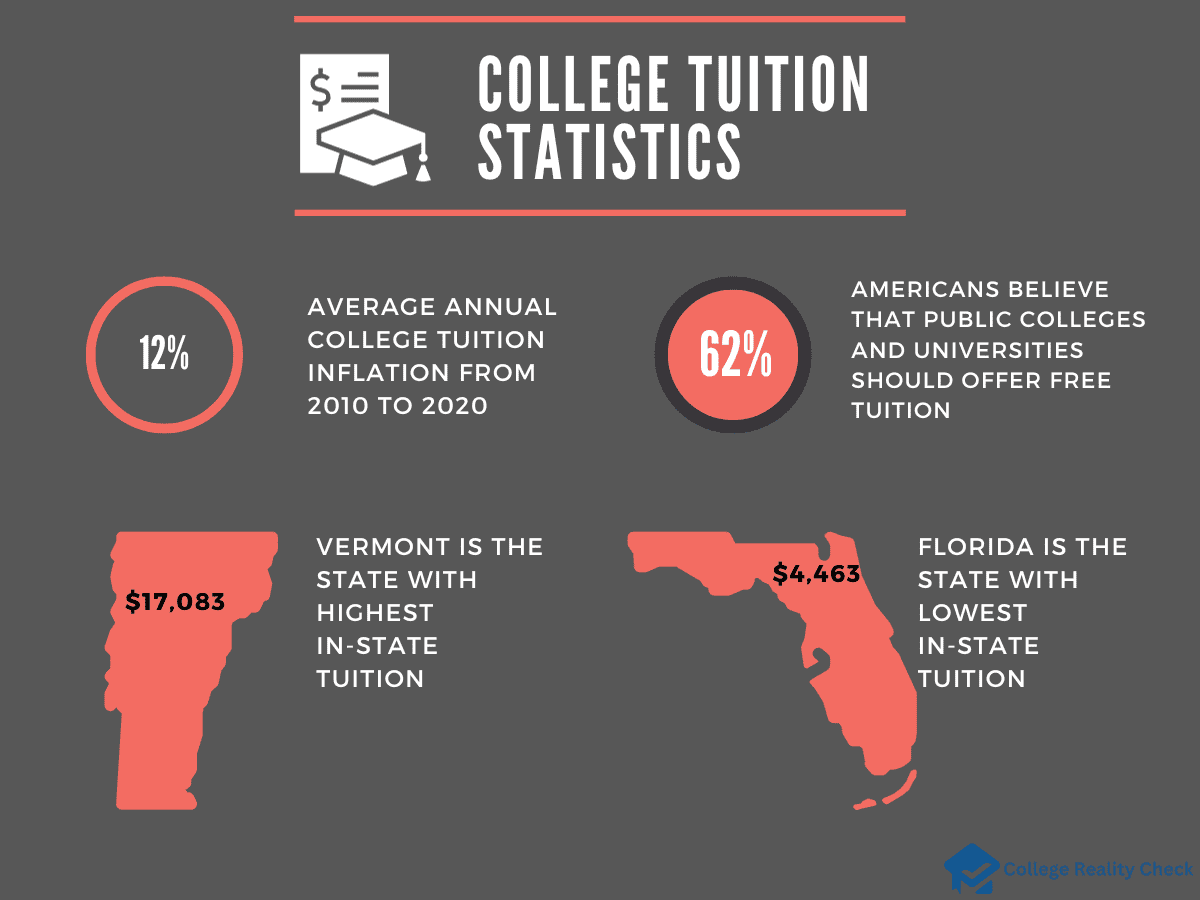
- According to the Education Data Initiative, the average annual college tuition inflation from 2010 to 2020 was 12% — the cost of tuition at 4-year public institutions in the US increased by 9.24% in the said decade.
- The worst decade for tuition inflation? Back in the 1980s, tuition costs increased by as much as 52%.
- Generally, tuition at public colleges is lower than at private ones. Tuition rates at some public schools are higher than the rest.
Of those, in-state tuition costs at 4-year public institutions in Vermont are the highest, averaging at $17,083 per year — tuition at National University and Virginia Union University, both of which are private schools, is lower.
- On the other hand, average in-state tuition costs at 4-year public institutions in Florida are the lowest: $4,463 per year.
- Still based on figures from the Education Data Initiative, Massachusetts, where prestigious schools like Brown University, Harvard University, Wellesley College and, of course, the Massachusetts Institute of Technology (MIT) are located, has the highest average tuition costs for 4-year private institutions, amount to $47,980 per year.
- 62% of Americans believe that public colleges and universities should offer free tuition.
- Well, there are a number of tuition-free institutions in the US these days, and, contrary to popular belief, not all of them are small, unknown schools.
US News mentions the following schools that charge students zero tuition:- Alice Lloyd College
- Berea College
- College of the Ozarks
- Deep Springs College
- The University of New Hampshire
College vs. No College Statistics
Weighing the pros and cons between earning a college degree and making do with a high school diploma is a step taken by many graduating high school students when deciding whether or not to pursue higher education.
Although a college diploma is not a requirement to attain success, it does open a lot of possibilities career- and personal satisfaction-wise.
- According to the National Center for Education Statistics, higher educational attainment usually means higher median earnings.
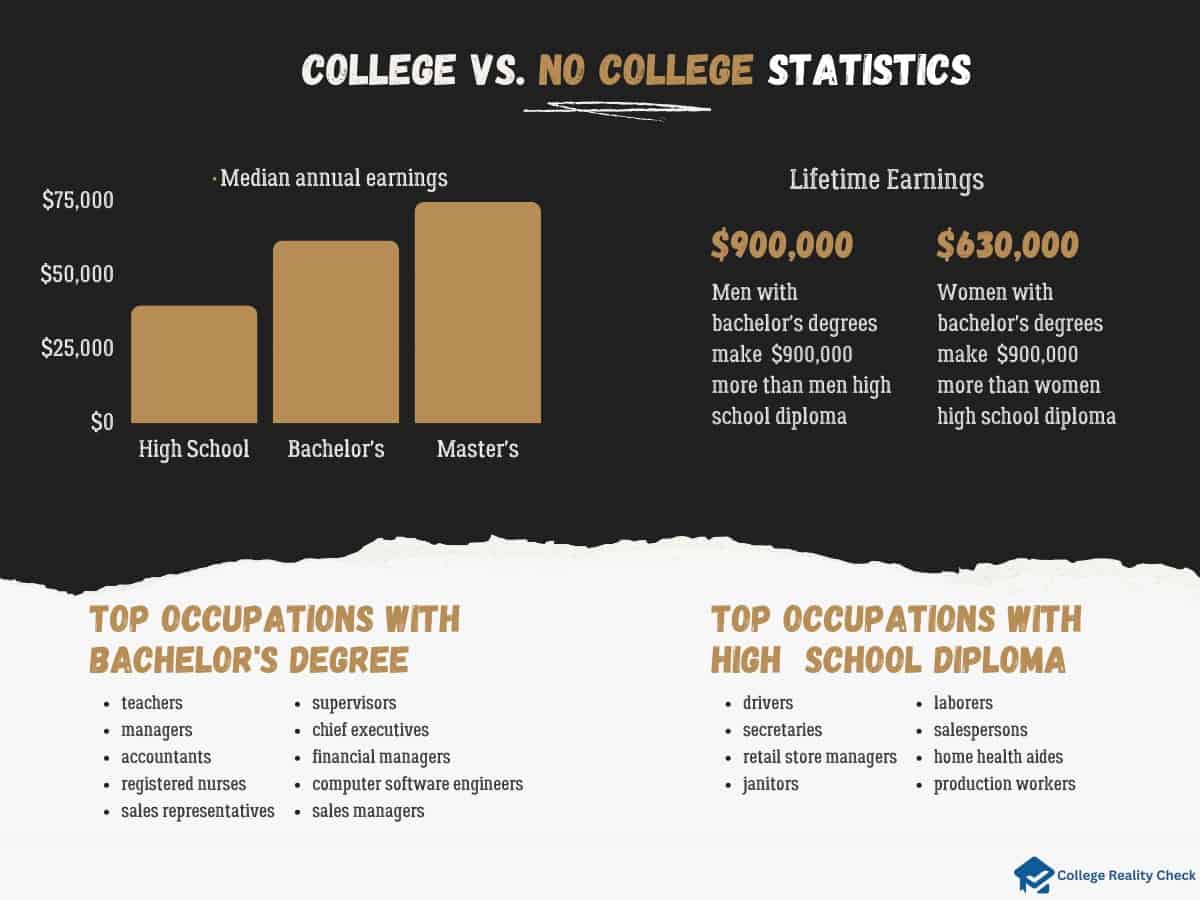
Last year, for instance, the median annual earnings of individuals with a bachelor’s degree was about 55% higher than those with a high school diploma — $61,600 vs. $39,700.
- The federal entity adds that, in the same year, the median annual earnings of individuals with a master’s degree or higher ($74,600) is around 21% higher than the median annual earnings of those with a bachelor’s degree.
- Meanwhile, the Social Security Administration says that men with bachelor’s degrees make approximately $900,000 more in median lifetime earnings than high school graduates.
Meanwhile, women with bachelor’s degrees earn about $630,000 more in median lifetime earnings than high school graduates.
- When it comes to those with graduate degrees, according to the same source, rake in $1.5 million more in median lifetime earnings than high school graduates, while women enjoy $1.1 million more than high school graduates.
- The Georgetown University Center on Education and the Workforce says that the following are the top 10 occupations of those with a bachelor’s degree:
- teachers
- managers
- accountants
- registered nurses
- sales representatives
- supervisors
- chief executives
- financial managers
- computer software engineers
- sales managers
- On the other hand, here are the most popular occupations for those with a high school diploma:
- drivers
- secretaries
- retail store managers
- janitors
- laborers
- salespersons
- home health aides
- production workers
- According to CNBC, the highest-paying college majors 4 years after graduation, with some paying over $100,000 per year, are as follows:
- nuclear engineering ($131,454)
- biomathematics ($116,918)
- operations research ($112,097)
- marine engineering ($109,121)
- computer science ($104,799)
College Admissions Statistics
In a nutshell, college admission is the process through which students enter postsecondary education at colleges and universities.
Such consists of different steps to be taken, from filling out the Common App or Coalition App, submitting application essays to filing the FAFSA form.
How hectic or simple the application process can vary from one institution to the next.
- Crimson Education says that the average high school GPA of students in the US is 3.0.
- The same source says that approximately 35% of individuals who don’t end up applying to college consist of those with a 3.0 high school GPA — most college applicants have high school GPAs that range between 3.5 and 4.0.
- In the fall of 2021, there were more than 15.4 million students who enrolled as undergraduates at degree-granting postsecondary institutions in the US, says the National Center for Education Statistics.
The said figure was 3% lower than the number of undergraduate students who matriculated in the fall of 2020 (15.9 million students).
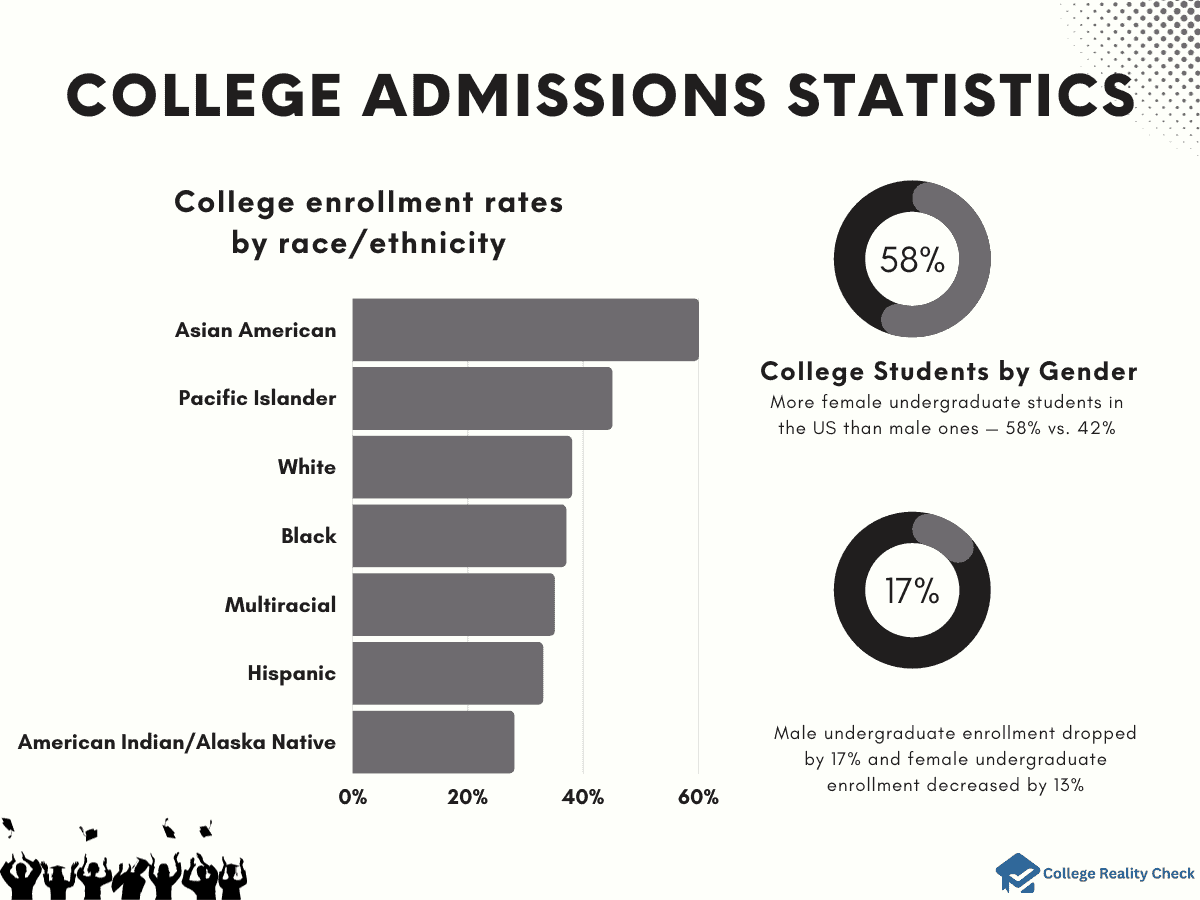
- The said federal entity says that there are more female undergraduate students in the US than male ones — 58% vs. 42%.
It adds that between 2010 and 2021, male undergraduate enrollment dropped by 17% (from 7.8 million to 6.5 million), while female undergraduate enrolment decreased by 13% (from 10.2 million to 8.9 million).
- Asian Americans have the highest college enrolment rates by race or ethnicity: 60%.
- Meanwhile, the following are the college enrolment rates for other races or ethnicity, again based on figures provided by the National Center for Education Statistics:
- Pacific Islanders (45%)
- Whites (38%)
- Blacks (37%)
- Multiracials (35%)
- Hispanics (33%)
- American Indians and Alaska Natives (28%)
- According to the Hardest Colleges to Get Into in America ranking by Niche, Minerva University, a private institution in San Francisco, is the hardest to gain admission to: it has a 1% acceptance rate.
- Here are the rest of the top 10 from the said college admissions ranking:
- California Institute of Technology
- Stanford University
- Harvard University
- Massachusetts Institute of Technology
- Columbia University
- Princeton University
- Yale University
- University of Pennsylvania
College Waitlist Statistics
Being put on a waitlist means that the student has met all of the admissions requirements of the college or university but its admissions committee could not offer him or her an acceptance letter as of yet.
Such could be due to different reasons, from the need for more information to having no available slot. A student on a waitlist may or may not get admitted.
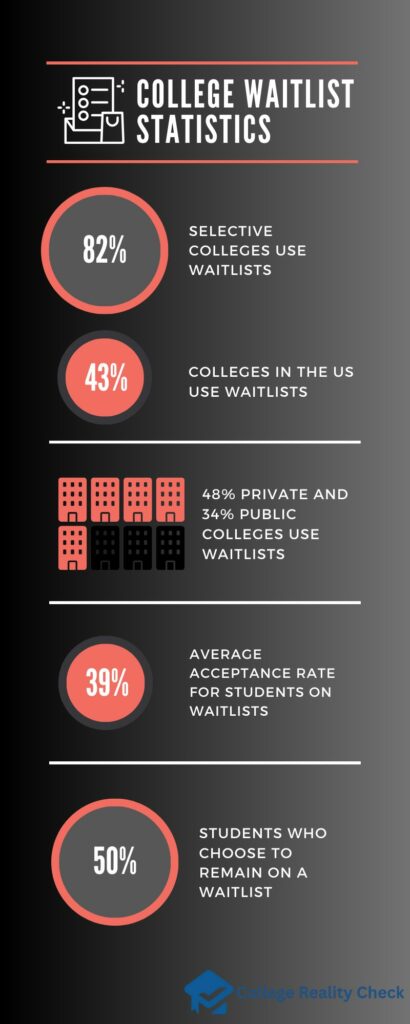
- The State of College Admission by the National Association for College Admission Counseling said that up to 43% of all postsecondary institutions in the US use waitlists.
- It adds that more private colleges and universities use waitlists than public ones — 48% vs. 34%.
- What’s more, up to 82% of the most selective institutions in the country use waitlists. As a matter of fact, typically, they are the ones that put a greater proportion of all applicants on waitlists — the average among all waitlisting schools is 10%.
Interestingly enough, selective schools are also those that are less likely to admit waitlisted students.
- According to a report by US News, the average acceptance rate for students on waitlists is about 39%.
Among selective institutions, however, the average percentage of students admitted off waitlists at selective colleges and universities, says the National Association for College Admission Counseling, is only 7%.
- Among the institutions that made it to the list of US News’ Best National Universities, the following are 10 of those where it’s hard for students to get off the waitlist and their acceptance rates:
- Chapman University (1.5%)
- University of Michigan – Ann Arbor (1.8%)
- Northwestern University (2.6%)
- Rensselaer Polytechnic Institute (2.8%)
- Case Western Reserve University (3.7%)
- Carnegie Mellon University (3.9%)
- Villanova University (4.0%)
- Southern Methodist University (4.2%)
- University of North Carolina – Chapel Hill (4.2%)
- Cornell University (4.4%)
- The average of students who choose to remain on a waitlist is only 50%.
College Internship Statistics
College internships are temporary work experience programs that give undergraduate students the opportunity to gain real-life knowledge and skills in their chosen field of study as they apply theoretical concepts learned in the classroom.
Internships also let college students build a network and increase their chances of getting job offers.
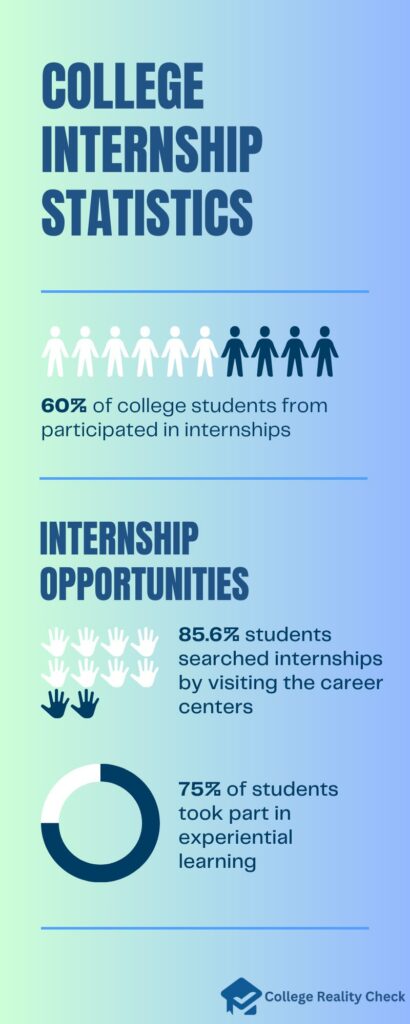
- Based on the figures from The Student Survey Report by the National Association of Colleges and Employers, at least 60% of college students from 2011 to 2017 participated in internships during their postsecondary careers.
From the start of the given time frame, students gradually became more and more likely to have had paid internship opportunities.
- How did the said students find internships?
The same source said that employer websites were considered by students the single most useful resource.
They are followed by family, friends and faculty members.
- Around 85.6% of those students started their hunt for internships by visiting the career centers of their schools.
- According to the National Survey of College Internships Report by the University of Wisconsin – Madison Center for Research on College-Workforce Transitions, however, the number of college students who had internships dropped to 21.5%.
But it says that some estimates agree that 50% to 60% of students participated in internships.
- As a matter of fact, based on a National Association of Colleges and Employers survey, more than 75% of all college students took part in experiential learning, although it includes not only internships but also other opportunities.
- While both paid and unpaid internships can be enriching, students who participated in paid ones are at an advantage — graduating seniors who have done paid internships receive an average of 1.61 job offers, while those who have done unpaid internships receive an average of 0.95 job offers.
- On the other hand, graduating seniors who did no internship receive an average of 0.77 job offers.
Working College Student Statistics
Employed college students work while working on their bachelor’s degree for different reasons.
Some of them do so for financial necessity, thus allowing them to cover some of the college costs and reduce educational debt.
Others work to gain work experience and develop skills, especially in their respective fields of study, while building a professional network at the same time.
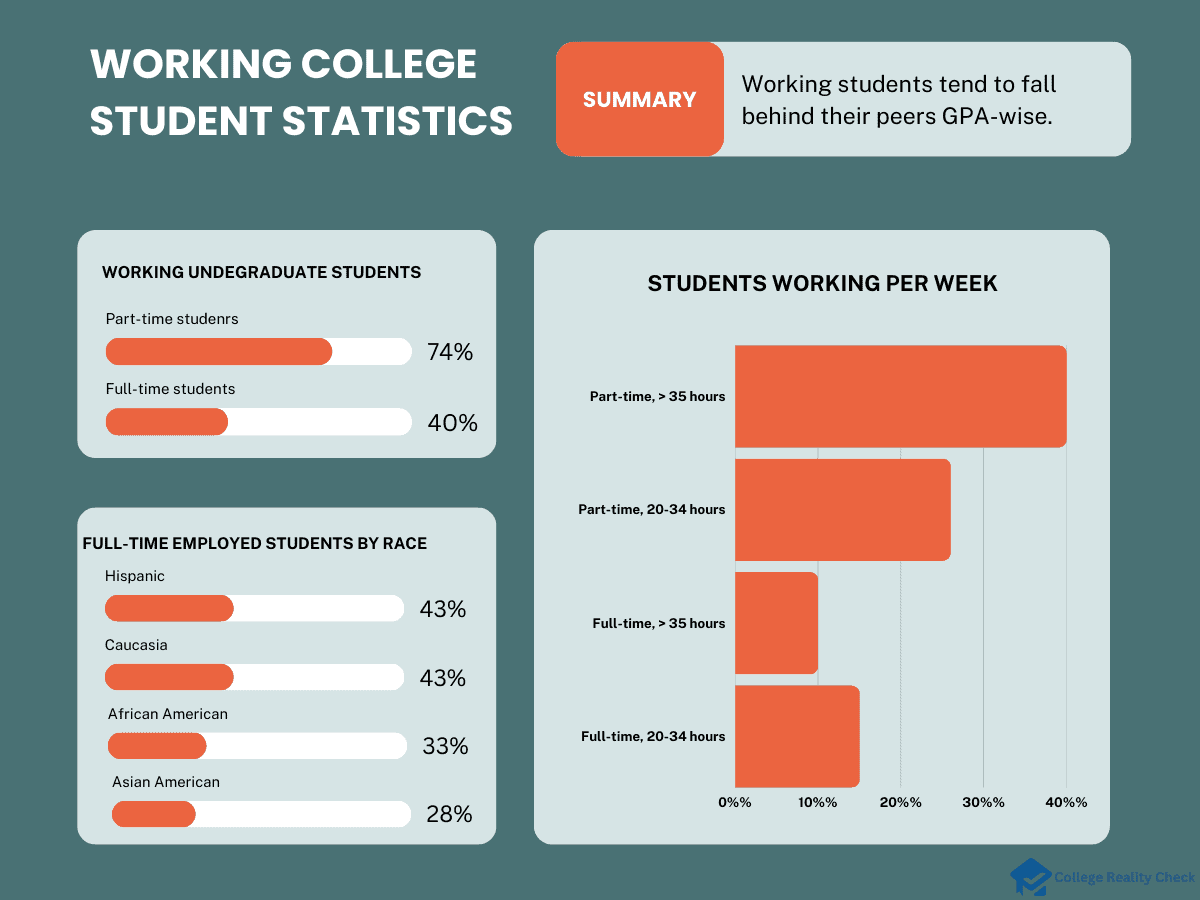
- The National Center for Education Statistics says that more undergraduate students who are enrolled part-time have jobs compared to full-time college students — for instance, only 40% of undergraduate students enrolled full-time were employed, while 74% of undergraduates enrolled part-time had jobs.
- Back in 2015, there were more working undergraduates. In the said year, around 43% of full-time undergraduate students were working, while 78% of part-time undergraduate students were employed.
- Not only are there more part-time undergrads who have jobs but part-time students also tend to work longer.
- Up to 40% of all part-time undergraduate students worked 35 or more hours per week.
Meanwhile, only 10% of full-time undergraduates worked the same hours.
Also, about 26% of all part-time undergraduate students worked 20 to 34 hours per week, while only 15% of full-time undergrads did so.
- In contrast, more full-time undergraduate students worked less than 20 hours per week in the same year compared to undergraduates who were enrolled part-time — 9% vs. 6%.
- Statistics from the National Center for Education Statistics say that 43% of full-time Hispanic students were employed, while 43% of full-time White students were working.
On the other hand, 33% of full-time Black students had jobs, while only 28% of full-time Asian students had jobs.
- As with part-time students in the same year, the following are the percentages of working undergrads based on race or ethnicity:
- Whites (78%)
- Hispanics (74%)
- Blacks (70%)
- Asians (56%)
- While working in college is not uncommon, working students tend to fall behind their peers GPA-wise.
- For instance, according to College Employment and Student Performance by The Wharton School of the University of Pennsylvania, students at 2-year colleges who are working every month receive on average 0.24 standard deviations lower GPAs.
In addition, they are 16% less likely to transfer to 4-year institutions than non-working students, whose average transfer rate is 45%. As such, they are also less likely to earn a bachelor’s degree than their peers.
College Student Stress Statistics
Many college students experience stress throughout their postsecondary careers for different reasons.
Some are brought about by financial constraints, while others can be related to grades, work and social concerns.
A combination of different factors may be the culprit, too. In any case, stress may affect one’s studies, depending on the severity and the student’s coping skills.
- A Changing America report by The Hill said that emotional stress is the most common reason that undergraduate students cite for considering dropping out of college.
- Of those, 76% were bachelor’s degree students, while 63% were associate degree students.
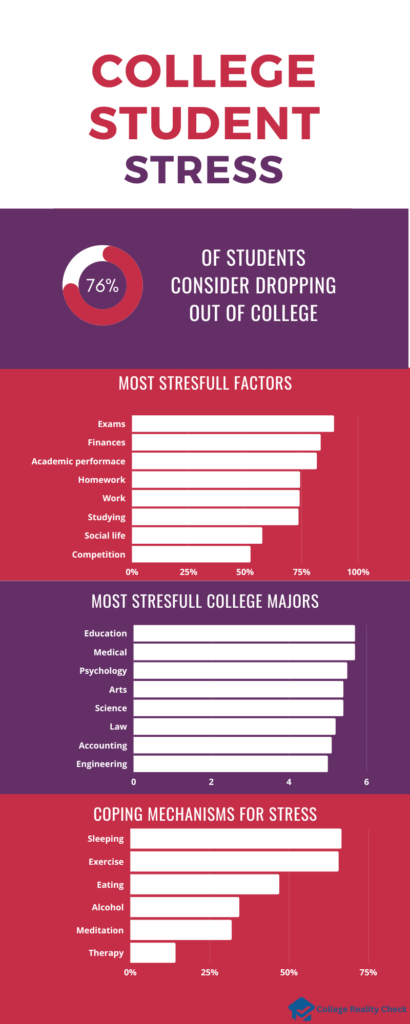
- According to American Addiction Centers called School Stress for College Students and Unhealthy Coping Mechanisms, the following are the most stressful factors in the lives of college students:
- exams (89,2%)
- financial issues (83.3%)
- academic performance pressure (81.6%)
- homework (74.2%)
- work (74.0%)
- studying (73.5%)
- balancing social life and schoolwork (71.2%)
- social life (57.5%)
- competition in class (52.3%)
- On the other hand, from the same post, here are the most stressful college majors based on a scale from 0 to 7, with 7 being extremely stressful:
- education (5.7)
- medical majors (5.7)
- psychology (5.5)
- arts (5.4)
- science (5.4)
- social sciences (5.4)
- IT (5.3)
- law (5.2)
- accounting and business (5.1)
- marketing (5.0)
- engineering (5.0)
- Want to have an idea of how to deal with stress once you’re in college?
Here are the top coping mechanisms for stress among undergraduates, still based on the American Addiction Centers data:- sleeping (66.5%)
- exercise (65.6%)
- eating (46.9%)
- alcohol (34.3%)
- meditation (31.9%)
- therapy (14.2%)
College Student Mental Health Statistics
Mental health problems can impact a student’s concentration, memory, optimism, motivation and even energy level.
Unfortunately for college students, there are many things during their postsecondary education pursuit that can wreak havoc on their mental health, including transitioning from high school to college, academic pressure, social isolation and financial stress.
- According to a report by the American Psychological Association, more than 60% of college students met the criteria for at least a single mental health problem during the academic year 2021 to 2022.
- In another study, the same report says, almost 75% of undergrads reported moderate to severe mental distress.
- Think again if you believe that mental health issues are something new among degree-seeking students: from 2009 to 2015, still based on the same American Psychological Association report, the number of enrollees obtaining help at campus counseling centers increased by almost 40%, and continued to rise until 2019.
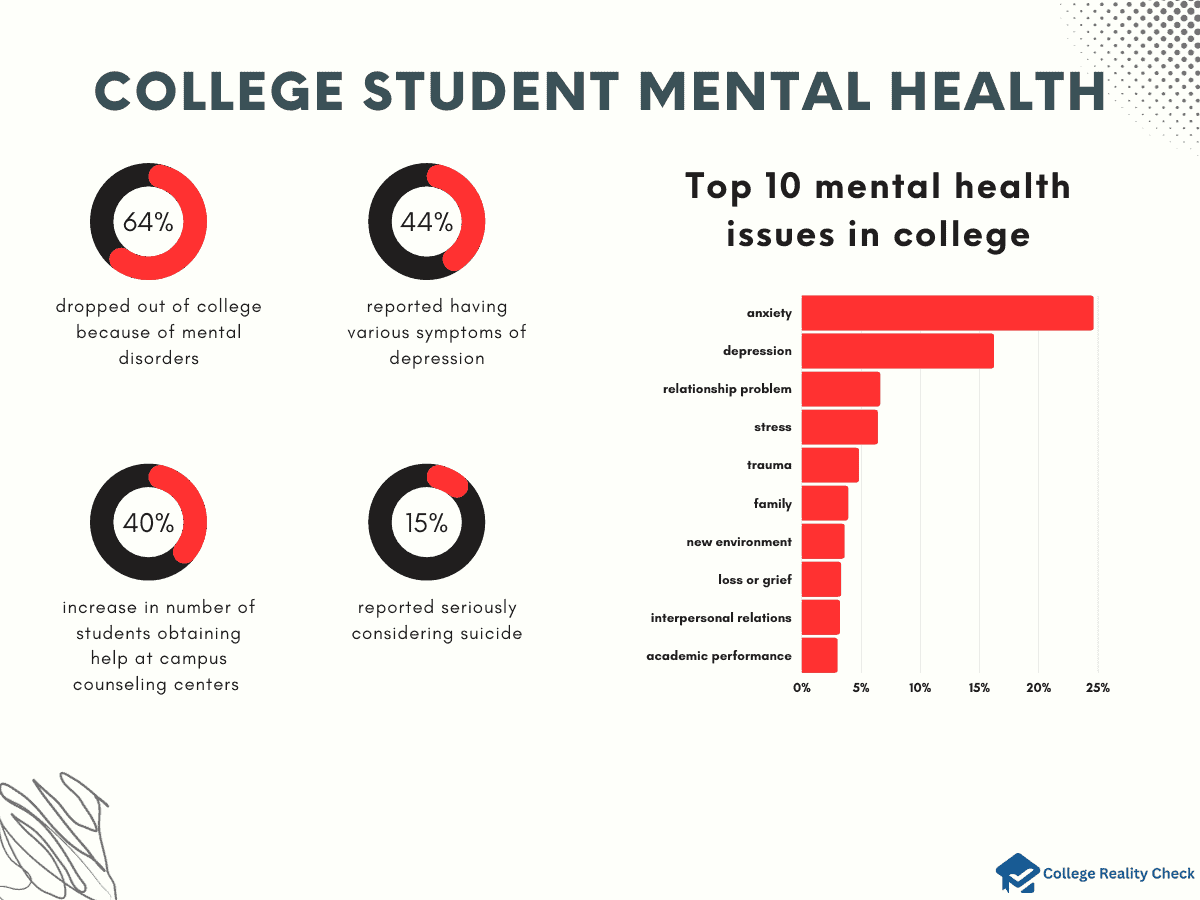
- Meanwhile, Michigan News by the University of Michigan says that the annual Healthy Minds Study found that 44% of college students reported having various symptoms of depression, while 37% reported experiencing different symptoms of anxiety.
The said study surveyed 96,000 students across more than 130 colleges and universities in the US during the 2021 to 2022 academic year.
- Around 15% of college students, on the other hand, reported seriously considering suicide.
- Speaking of which, the same Michigan News post adds that the reporting of suicidal ideations is, on average, more likely to be done by LGBTQIA+ college students than their peers.
- The National Alliance on Mental Illness says that, as reported by CNBC, around 64% of all college students in the country drop out of college because of mental disorders.
What’s even more alarming is that among those who quit their studies because of the said reason, up to 50% refuse to access mental health services.
- Here are the top 10 issues of college students who consulted mental health clinicians as reported by Statista, and the percentage of clinicians that stated them:
- anxiety (24.6%)
- depression (16.2%)
- relationship problem (6.6%)
- stress (6.4%)
- trauma (4.8%)
- family (3.9%)
- adjustment to new environment (3.6%)
- loss or grief (3.3%)
- interpersonal functioning (3.2%)
- academic performance (3%)
College Students Sleep Statistics
Having sufficient sleep per night is important for college students.
Otherwise, their cognitive abilities can become impaired, thus causing their grades to suffer.
In addition, sleep deprivation can increase the risk of mental health issues such as anxiety and depression as well as weaken the immune system, which can lead to increased susceptibility to illnesses.
- The study Causes and Consequences of Sleepiness Among College Students published by the National Library of Medicine says that up to 70% of college students are getting less than 8 hours of sleep at night.
This is despite the fact that as much as 80% of them are aware that inadequate sleep can negatively impact their school performance.
- As a result of this, around 50% of sleep-deprived college students report experiencing daytime sleepiness.
- According to the same study, daytime sleepiness combined with lack of sleep can lower GPAs, increase risk of failing academically, impair the mood and increase risk of motor vehicle accidents.
- Meanwhile, based on a post by Harvard Summer School, 70% to 96% of all college students fail to get at least 8 hours of sleep per night, and more than 50% of them are actually getting less than 7 hours of sleep nightly.
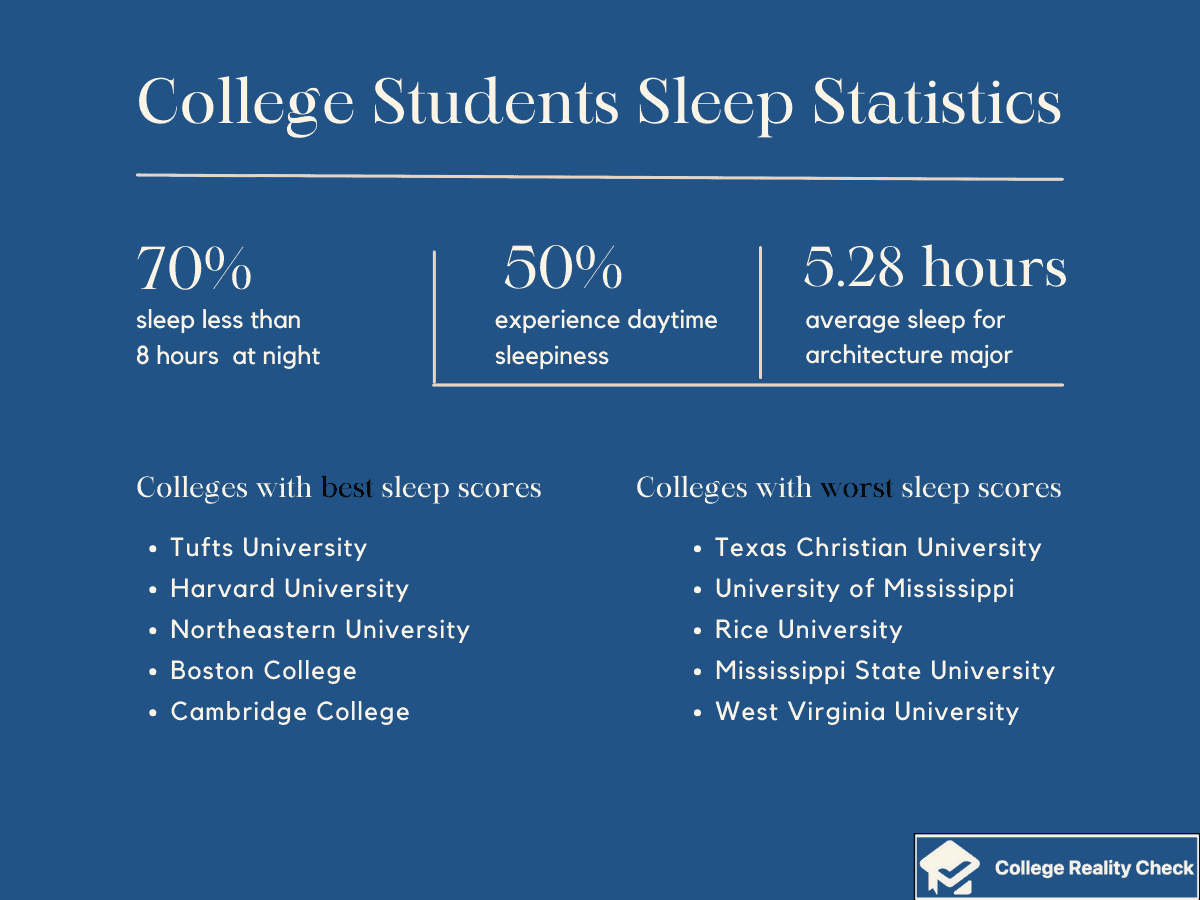
- Here are the top most sleep-deprived college majors and the average hours of sleep students get per night, as pointed out by an infographic by The Tab:
- architecture (5.28 hours)
- nursing (5.69 hours)
- biochemistry (5.69 hours)
- creative writing (5.75)
- ecology (5.75 hours)
- linguistics (5.88 hours)
- fashion (5.90 hours)
- chemistry (5.92 hours)
- sports science (5.92 hours)
- music (6.00 hours)
- anthropology (6.00 hours)
- computer science (6.00 hours)
- urban planning (6.01 hours)
- physics (6.04 hours)
- engineering (6.05 hours)
- marketing (6.05 hours)
- This yeat, Sleepopolis published the best colleges for sleep based on various sleep-related factors such as body mass index (BMI) and air quality, and here are the top 5 and their respective sleep scores:
- Tufts University (7.73)
- Harvard University (7.71)
- Northeastern University (7.67)
- Boston College (7.63)
- Cambridge College (7.59)
- On the other hand, the following are the top 5 worst colleges for sleep:
- Texas Christian University (3.24)
- University of Mississippi (3.21)
- Rice University (3.16)
- Mississippi State University (3.07)
- West Virginia University (3.07)
Academic Dishonesty in College Statistics
Cheating in college is commonplace. Different degree-seeking students cheat for different reasons.
For instance, while some cheat to get high grades or meet the expectations of their parents, others do so as a result of lack of self-confidence or being overwhelmed by their workload.
The internet and various technologies make cheating in college easier than ever.
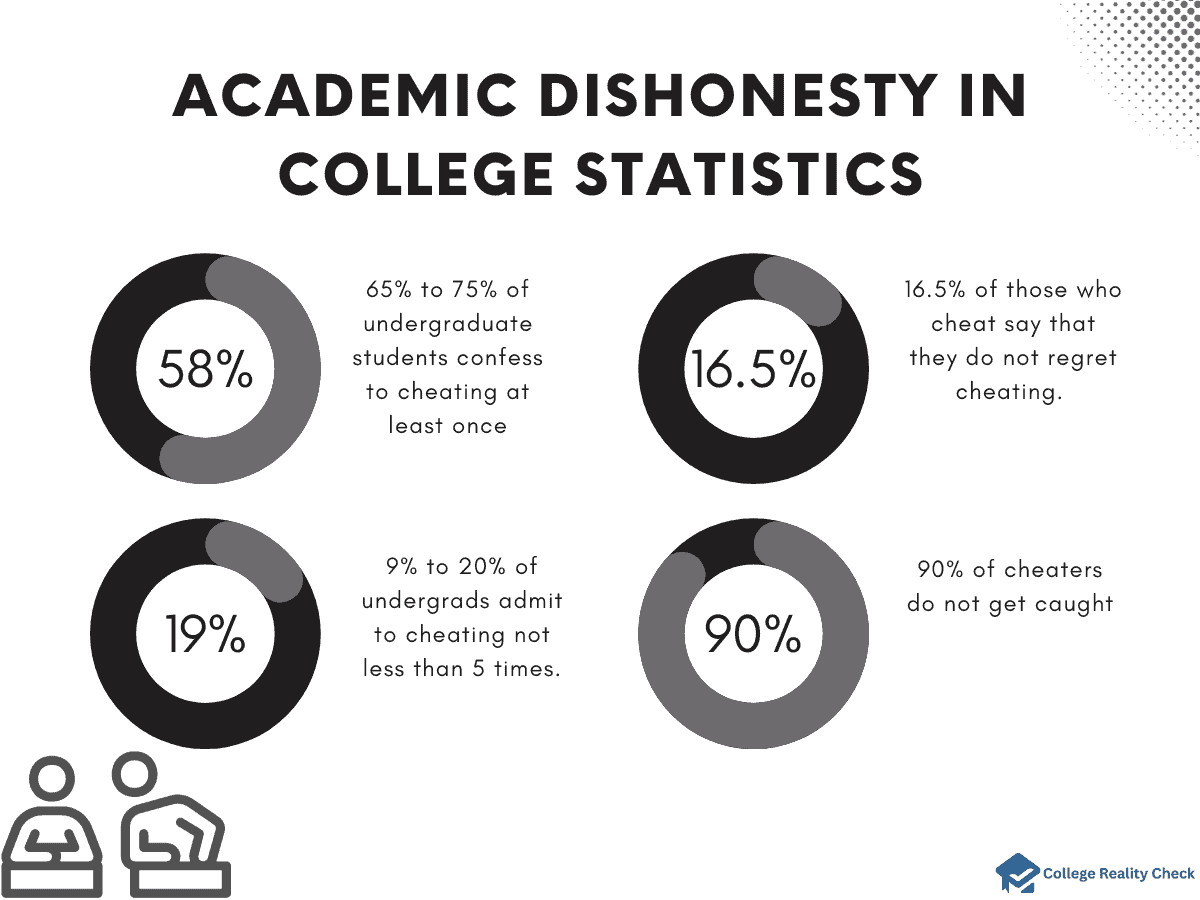
- A survey shared by the College of Arts and Sciences at the University of Alabama says that 65% to 75% of undergraduate students confess to cheating at least once.
- On the other hand, 19% to 20% of undergrads admit to cheating not less than 5 times.
- According to the figures posted by the Open Education Database, around 16.5% of those who cheat say that they do not regret cheating.
And here’s a somewhat unsurprising fact from the same source: based on a poll conducted at Fordham University, cheaters usually have higher GPAs than non-cheaters — the average GPA of college students who cheat is 3.41, while the average GPA of those who refuse to cheat is 2.85.
- ProctorEdu, meanwhile, says that, based on various surveys, up to 90% of cheaters do not get caught, and around 90% of cheating students are certain they will not get caught.
Time Management College Students Statistics
College students must possess good time management skills to effectively plan and organize their time and prioritize important tasks and meet crucial deadlines.
This is especially true since students who are working on a college degree have so many things to balance, from doing their assignments to studying for exams and from going to their part-time jobs and socializing.
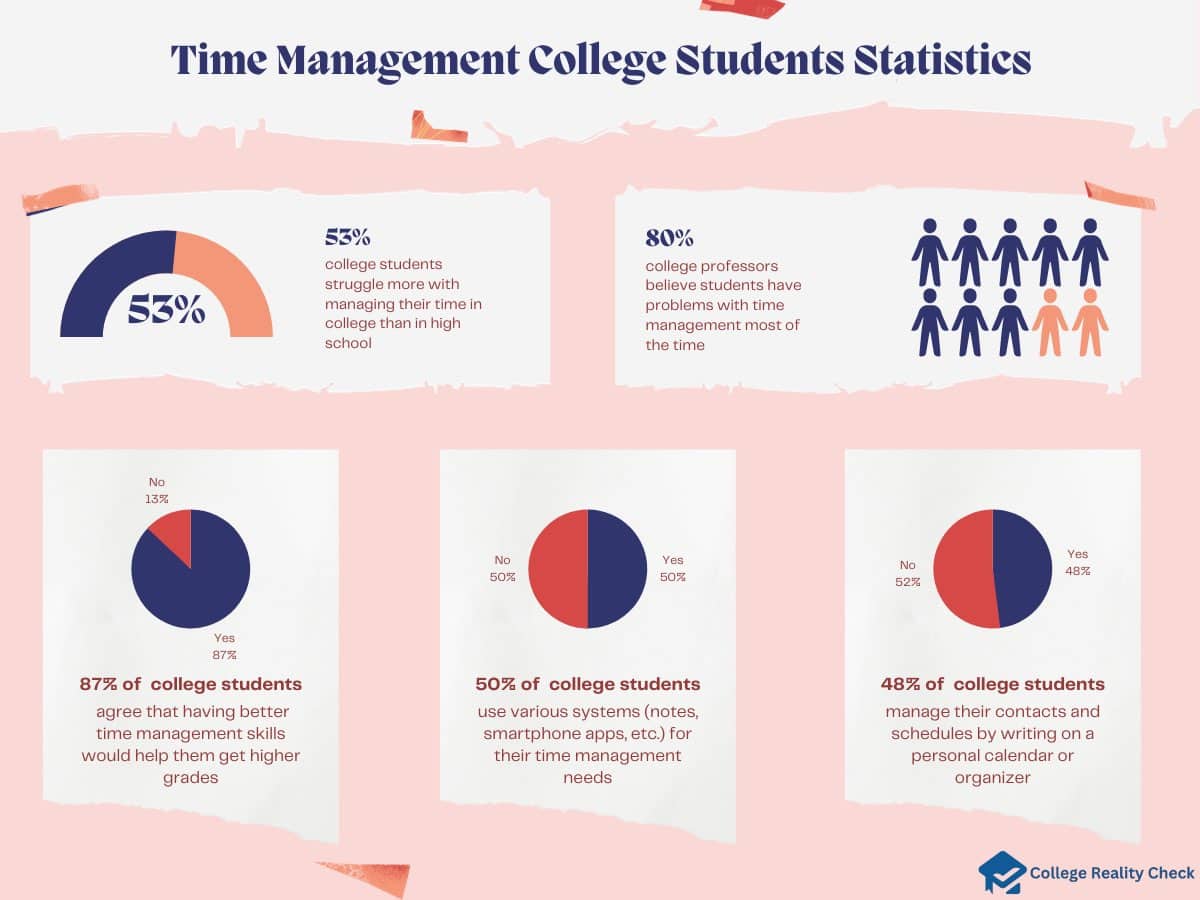
- Based on the Student Engagement Insights survey by Cengage, as College Success Plan reports, up to 53% of college students agree to struggle more with managing their time in college than in high school.
Additionally, approximately 9% of them constantly struggle with time management.
- Still according to the same survey, around 80% of college professors believe that their students have problems with time management most of the time.
- Meanwhile, the results of a survey conducted by FileMaker, Inc. appeared on Reliable Plant.
The said survey found that 48.4% of college students say that they don’t have enough time to do their coursework.
Also, about 47% of them feel that their high school did not prepare them with the time management skills needed to survive college.
- As much as 87% of surveyed college students agree that having better time management skills would help them get higher grades, while 88% of them want to improve their ability to budget their time.
- And now, let’s take a look at how college students, still based on the same survey, attempt to manage their time well.
Up to 50% use various systems (handwritten notes, smartphone apps, etc.) for their time management needs.
On the other hand, 48% manage their contacts and schedules by writing on a personal calendar or organizer.
Around 23% keep track of things to do by memory only, while only 22% organize everything using database software tools.
College Student Procrastination Statistics
It’s common knowledge that college students have more on their plate than high school students.
After all, they just have a few years to obtain all the skills and qualifications they need to commence their professional careers.
However, it’s not uncommon for many college students to also put off important work, including the kinds necessary for graduating.
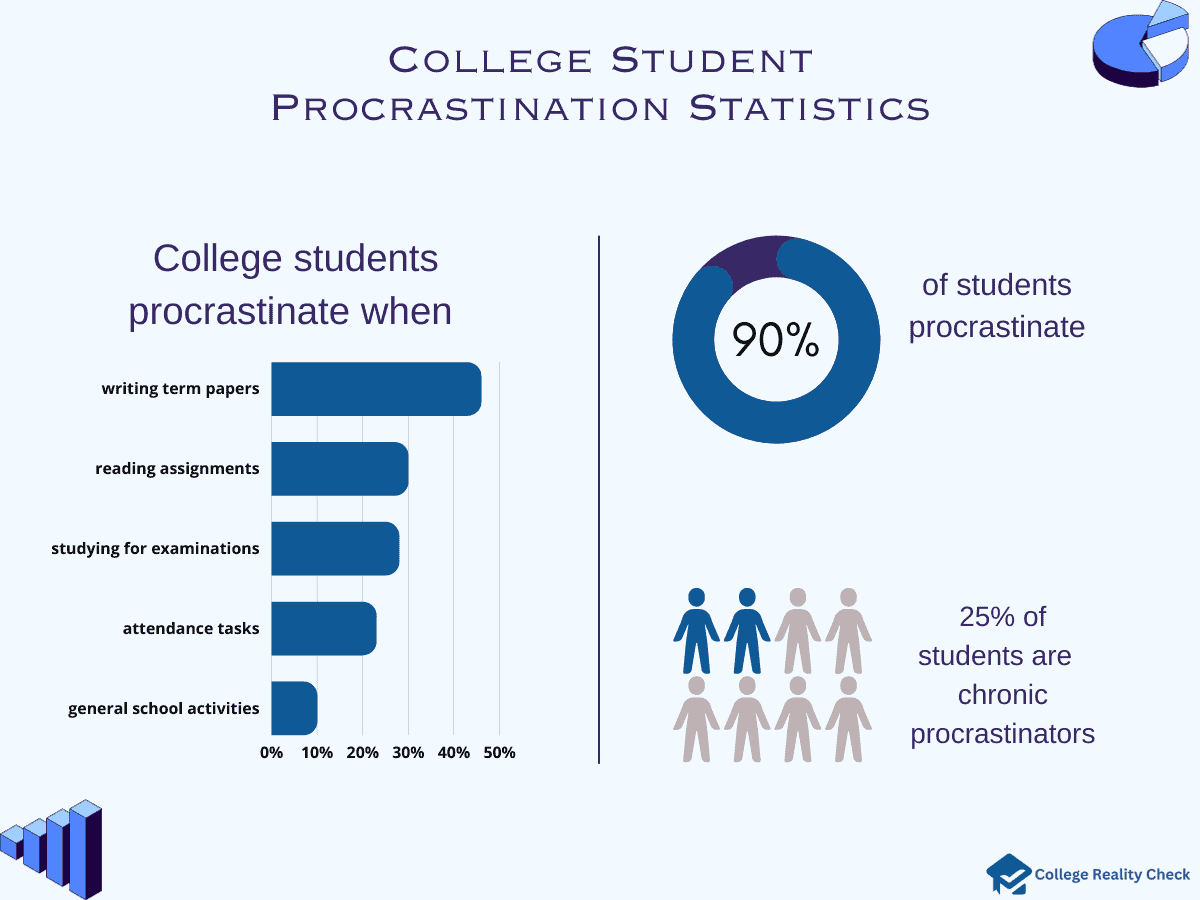
- According to a psychologist, as reported by Piedmont Technical College, approximately 90% of college students procrastinate. What’s more, around 25% of them wind up becoming chronic procrastinators.
- The same report added that many college students who procrastinate chronically end up dropping out.
- On the other hand, Edutopia says that, based on a journal published by APA PsycNet of the American Psychological Association, it is estimated that 80% to 95% of college students partake in procrastination.
As a matter of fact, as it adds, around 75% of all procrastinating college students agree that they are in fact procrastinators.
- Believe it or not, not having any care about assignments is not the primary reason for procrastination among college students.
Still based on the same Edutopia report, a social psychology professor at Loyola University said that, more often than not, reasons why college students procrastinate can fall under 2 main categories:- confusion about the initial step of the assignment
- and fear of failure.
- Grades drop by as much as 5% as submissions get closer to deadlines, says research by Warwick Business School of the University of Warwick, which is a public research institution in England.
- The prevalence of procrastination, interestingly enough, can vary from the task, as stated in a post by Solving Procrastination.
For instance, based on a study done on students in a psychology course:- 46% procrastinate on writing term papers
- 30% procrastinate on reading assignments
- 28% procrastinate on studying for examinations
- 23% procrastinate on attendance tasks
- 10% procrastinate on general school activities.
- Students confess, as indicated by the same post, that procrastination consumes about one-third of their time, which they spend watching TV, playing video games or sleeping.
College Student Social Media Usage Statistics
Social media is a collection of websites and apps that focus on content-sharing, interaction and communication.
Most individuals who are in college are on social media, too.
While there are perks to the use of social media, including communicating with peers, access to information and building a network, there are also downsides, especially with excessive usage.
- More than 98% of college students are on social media, which is why they make for lucrative targets for businesses and companies advertising on the internet.
- While there’s no denying that YouTube and Facebook are some of the most popular platforms (a Pew Research Center survey says that 81% and 69% of American adults use them), others have a strong following among young adults.
- As a matter of fact, here are the percentages of individuals aged 18 to 29 who use other social media:
- 71% say they use Instagram
- 65% say they use Snapchat
- roughly 50% say they use TikTok
- LinkedIn is more likely to be used by individuals with higher levels of education, says the same study.
For instance, around 51% of adults with a bachelor’s degree or a higher qualification use the business- and employment-focused social media platform.
On the other hand, about 21% of individuals with some college but no degree use LinkedIn, while less than 10% of those with a high school diploma or less use it.
- Based on data from the Journal of University Teaching & Learning Practice, as much as 69.7% of college students post at least once a day on Snapchat.
On the other hand, 43.2% of them post on Twitter at least once daily.
Meanwhile, about 39.7% and 34.2% of college students post not less than once a day on Facebook and Instagram, respectively.
- As with social media addiction among students in college, here are the numbers from Cross River Therapy:
- more than 60% of college students in the US report being addicted to social media
- around 70% of them check their social media accounts several times a day
- over 60% of them confess to feeling anxious when unable to access their accounts.
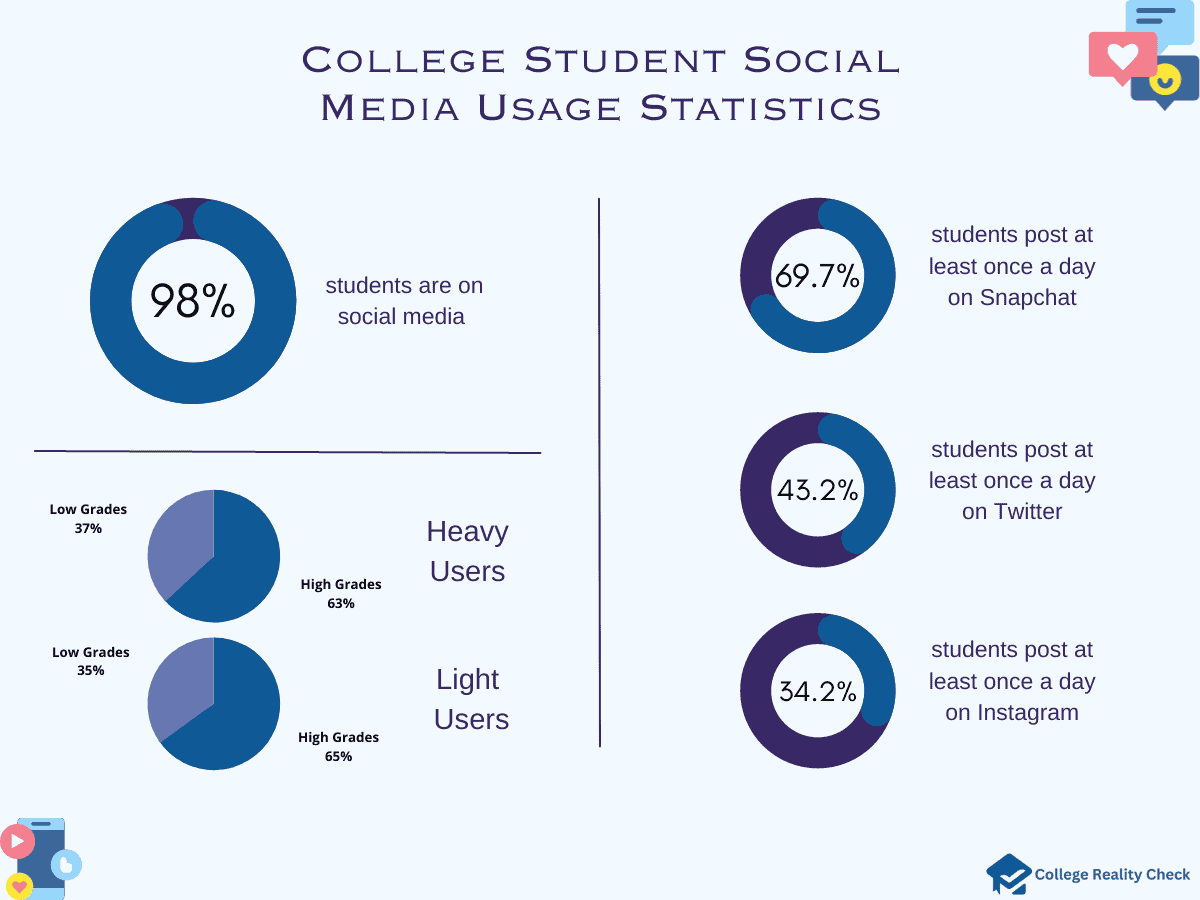
- Interestingly, college student grades are not affected by social media use, at least according to a study by the University of New Hampshire.
It found that 63% of heavy users got higher grades than 65% of light users.
And although 37% of heavy users received low grades, 35% of light users received low grades, too.
College Relationships Statistics
The Counseling Center of Northwest Missouri State University says that relationships are at the top of the list of priorities of college students.
They include relationships with their family members, friends and roommates as well as dating relationships.
In this part of the post, let’s take a look at some important stats on college romantic relationships.
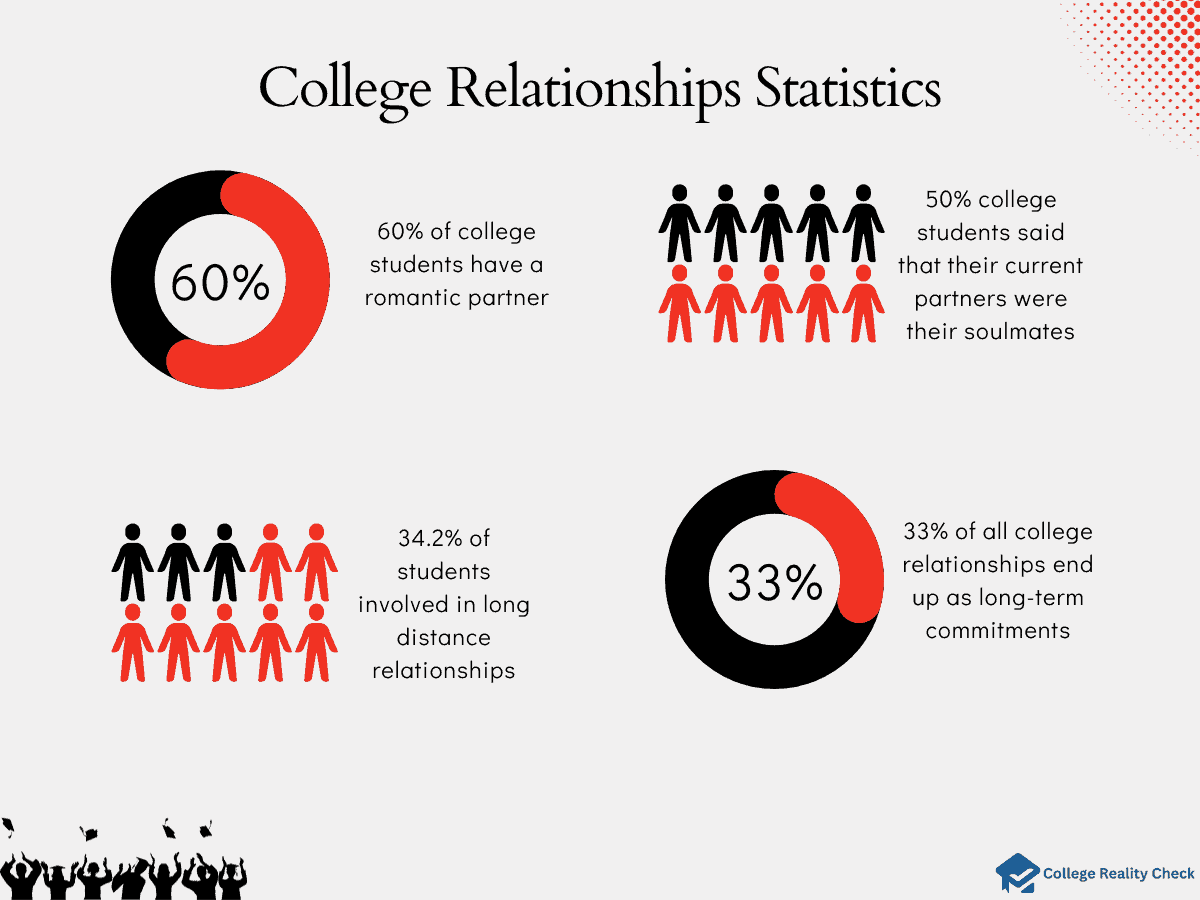
- Gitnux says that, according to a study conducted by Pennsylvania State University, around 60% of college students have a romantic partner at some point during their postsecondary careers.
Meanwhile, as per a USA Today report, approximately 56% of college couples go steady after a month of dating.
- And then Gitnux adds that, as per a study made by Harvard University study, only around 33% of all college relationships end up as long-term commitments.
- Based on another source (Stanford University), meanwhile, up to 90% of college students use dating sites or apps.
- According to a study reported by Online Divorce, around 28% of all college relationships that tend to last for a long time are those that are formed between students attending the same academic institutions.
- Most colleges and universities where lasting relationships form are those with religious affiliations.
- Do soulmates exist?
Well, for surveyed college students in another study mentioned by the same source, nearly 50% of college students said that their current partners were their soulmates.
After the survey, it was found that the said relationships lasted for 8 months or longer.
- A survey on long-distance relationships published by the National Library of Medicine says that 34.2% of romantically involved college students were in LDRs, which are much more common in younger than in older students.
LDRs are also more prevalent among Asians, Hispanics and multiracials than students from other racial or ethnic backgrounds.
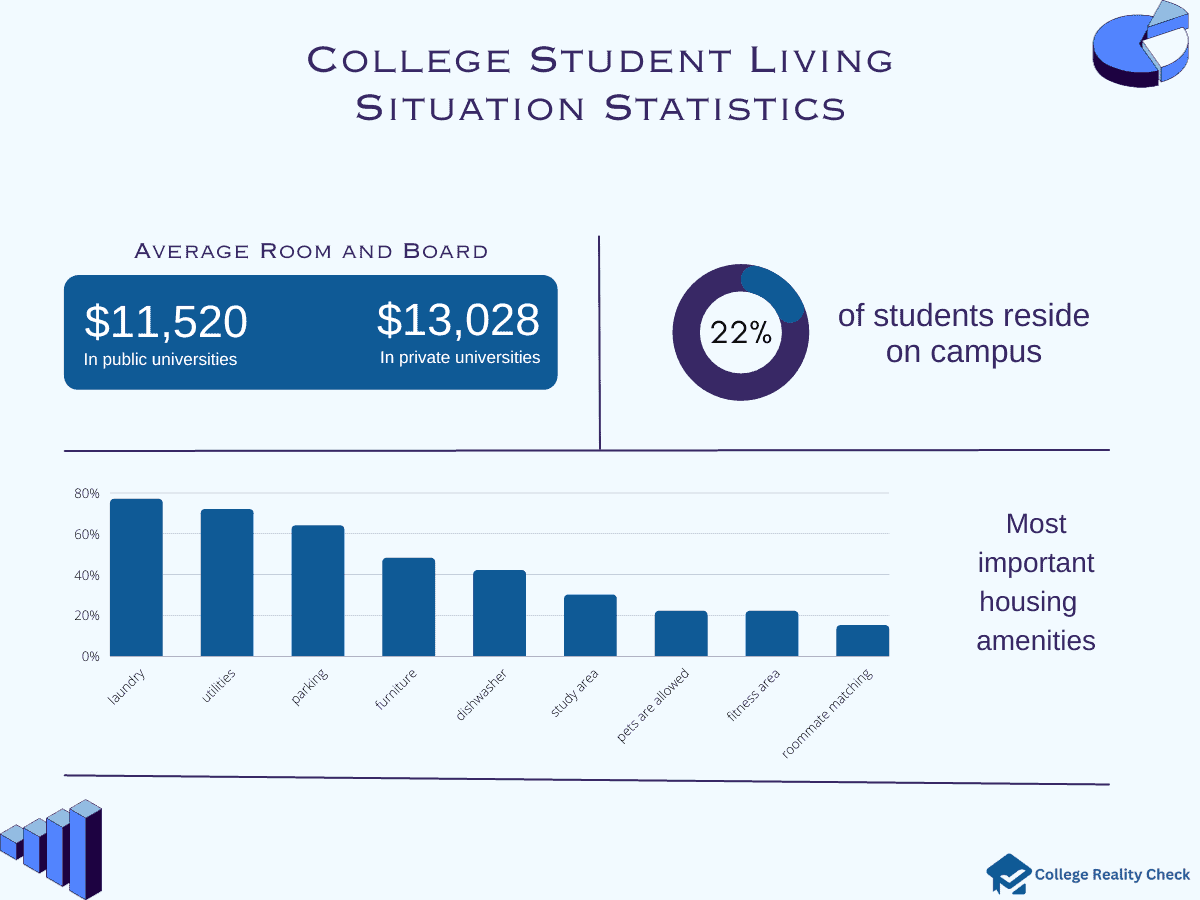
College Student Living Situation Statistics
Next to tuition, room and board make up a huge portion of the annual cost of college.
For many first-time, first-year students (and some sophomores, too) they have no choice but to reside on-campus as a part of the institutional requirements.
Others who are attending out-of-state schools or in-state schools far from their respective homes may choose to reside off-campus.
- Finances Online says that only 22% of college students in the US reside in on-campus housing options. On the other hand, 23% of them live in off-campus housing provision.
- The same source said that, according to 78% of surveyed college students, Wi-Fi is the most important amenity in any student housing.
And here are other important amenities by the percentage of respondents who answered them:- laundry (77%)
- utilities (72%)
- parking (64%)
- furniture (48%)
- dishwasher (42%)
- study area (30%)
- pets are allowed (22%)
- fitness area (22%)
- roommate matching (15%)
- On average, On-campus residents at public 4-year institutions, say the Education Data Initiative, pay $11,520 per year for room and board, while off-campus residents pay $11,365 per year.
- Meanwhile, at private, non-profit 4-year institutions, on-campus residents pay an average of $13,028 per year for room and board, while off-campus residents pay $11,269 per year.
- Research.com says that up to 63% of student housing at colleges and universities in the US consists of private rooms rather than shared rooms or apartments.
The site adds that, back in 2018, there were a total of over 32,000 homeless college students in the country.
- According to Student Beans Blog, 1 in 5 college students in the US have faced housing insecurity.
- It adds that college students in Florida are most likely to be having housing insecurity, an estimated 29% of them.
Meanwhile, the following are the percentages of college students in states that have faced housing insecurity:- Texas (26%)
- Georgia (24%)
- California (21%)
- Illinois (20%)
- North Carolina (17%)
- Pennsylvania (14%)
- Ohio (14%)
- Michigan (13%)
- New York (13%)
College Student Greek Life Statistics
Greek life refers to fraternities and sororities on campus.
While popular media portray members of these organizations as nothing but partygoers, beer-drinkers, class-skippers and pranksters, being a part of Greek life actually comes with many perks.
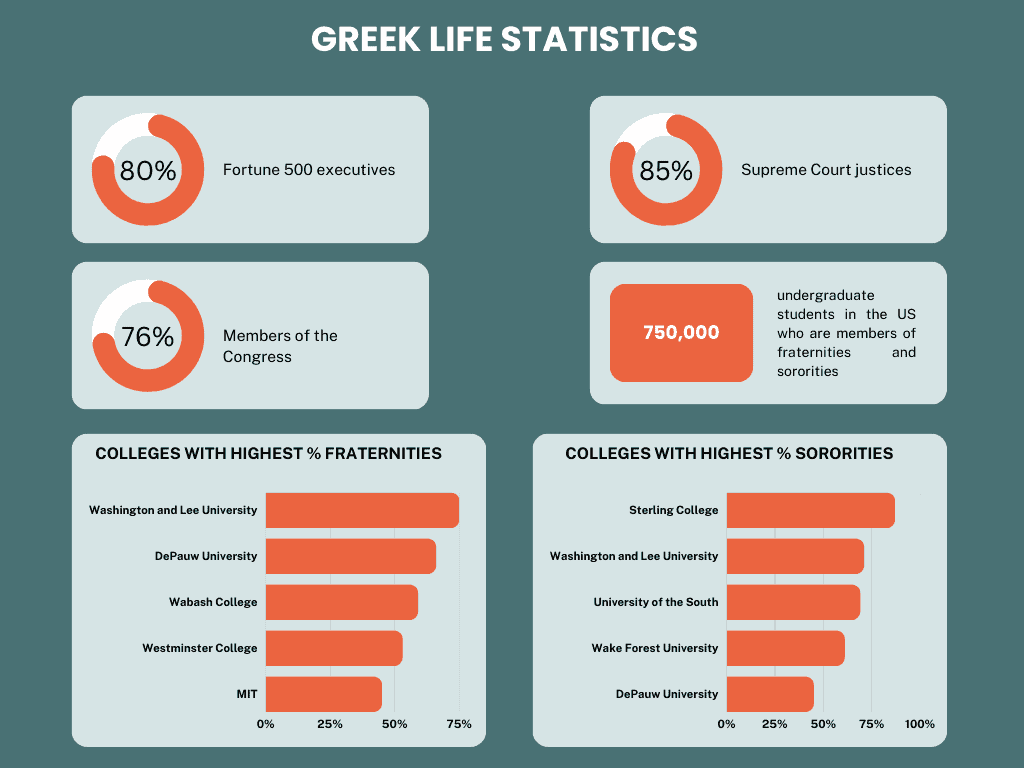
For instance, it allows members to partake in philanthropic activities and build professional networks.
- Various sources say that there are about 750,000 undergraduate students in the US who are members of fraternities and sororities. And, in North America, a total of 9 million college students and alumni are members.
- Speaking of alumni members, up to 80% of all Fortune 500 executives belong to a fraternity. The same is true for 85% of the Supreme Court justices and 76% of the members of Congress.
- According to US News, the following institutions have the highest percentages of male undergraduates who are a part of fraternities:
- Washington and Lee University (75%)
- DePauw University (66%)
- Wabash College (59%)
- Westminster College (53%)
- Centre College (51%)
- University of the South (51%)
- Millsaps College (50%)
- Murray State University (46%)
- Massachusetts Institute of Technology (45%)
- On the other hand, the following are the colleges and universities with the highest percentages of female undergraduates who are a part of sororities, still by US News:
- Sterling College (87%)
- Washington and Lee University (71%)
- University of the South (69%)
- Wake Forest University (61%)
- DePauw University (59%)
- Samford University (59%)
- Texas Christian University (57%)
- Augustana College (55%)
- Murray State University (54%)
- The University of North Texas, meanwhile, has the smallest Greek life, with only 1% of its students in frats.
- When it comes to hazing, here are the figures pulled by a University of Maryland report from various sources:
- more than 50% of college students are involved in some form of hazing
- in 95% of hazing cases, students who knew they were hazed did not report it
- for every 10 students being hazed, only 1 realizes being hazed
- The report adds that 44 states in the US have anti-hazing laws.
College Students Change Majors Statistics
Changing majors is a possibility among college students.
There are different reasons why college students switch majors, including learning that their current majors do not align with their chosen career path and discovering a new career prospect or area of interest.
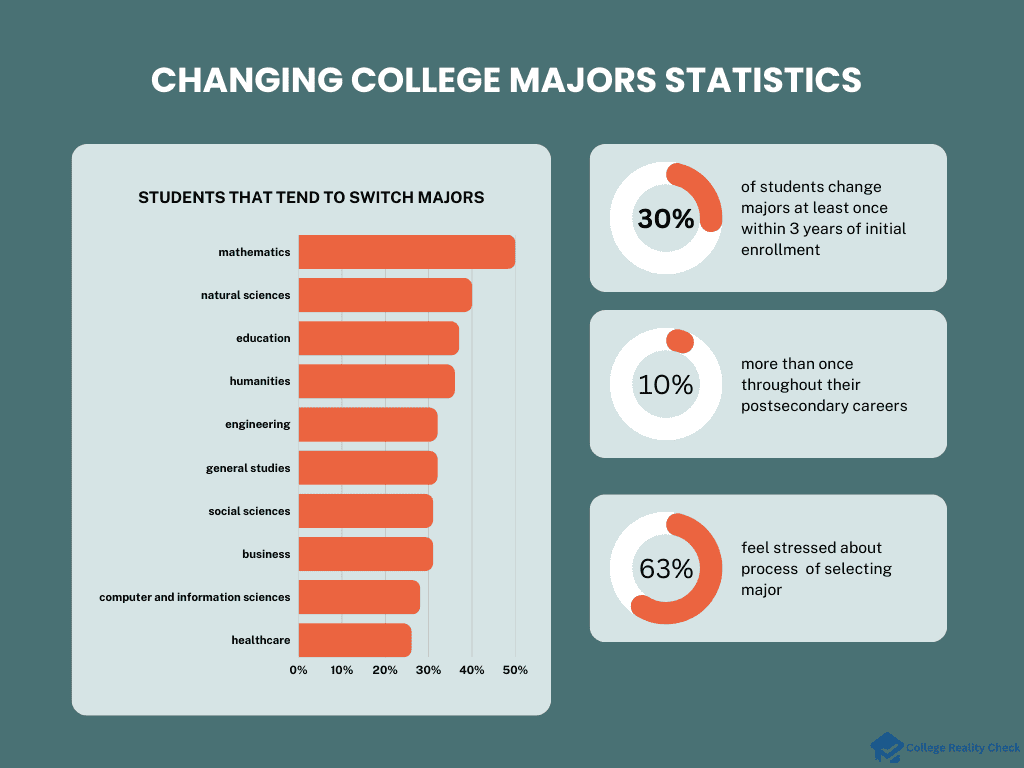
There is no limit to the number of times undergrads can change majors, but policy varies from college to college.
- According to Data Point by the National Center for Education Statistics, about 30% of all associate and bachelor’s degree students in the US change their majors at least once within 3 years of initial enrollment.
- Of those, about 1 in 10 change majors more than once throughout their postsecondary careers. Slightly more associate degree students do so than bachelor’s degree students — 10% vs. 9%.
- The same source says that the rate at which undergraduate students change their majors varies according to their initial field of study.
For instance, around 35% of college students who declare a STEM major switch to a different major within 3 years.
On the other hand, about 29% of those who declare a non-STEM major change majors within 3 years.
- Among all majors, mathematics causes more undergraduates (52%) to switch majors within 3 years.
- Here are the percentages of undergraduate students that tend to switch majors within the said time frame, still based on Data Point figures:
- 40% (natural sciences)
- 37% (education)
- 36% (humanities)
- 32% (engineering)
- 32% (general studies)
- 31% (social sciences)
- 31% (business)
- 28% (computer and information sciences)
- 26% (healthcare)
- Based on an Ellucian survey, as reported by Business Wire, nearly two-thirds of students feel overwhelmed by the college major selection process.
It adds that gen z and millennials are the most stressed (68% and 63%, respectively), followed by gen x students (49%).
- The same survey says that 1 in 3 students have no idea which major goes with their chosen career paths.
College Dropout Statistics
College dropouts are students who leave school before completing their degree programs. Reasons for quitting college can vary from one undergraduate to the other.
While there are obvious perks to earning a college degree, leaving college isn’t necessarily a bad thing as it worked for dropouts such as Steve Jobs, Bill Gates and Mark Zuckerberg.
- According to the Education Data Initiative, freshmen college students have a 12-month dropout rate of 24%, which means that nearly a quarter of them quit college before their sophomore year.
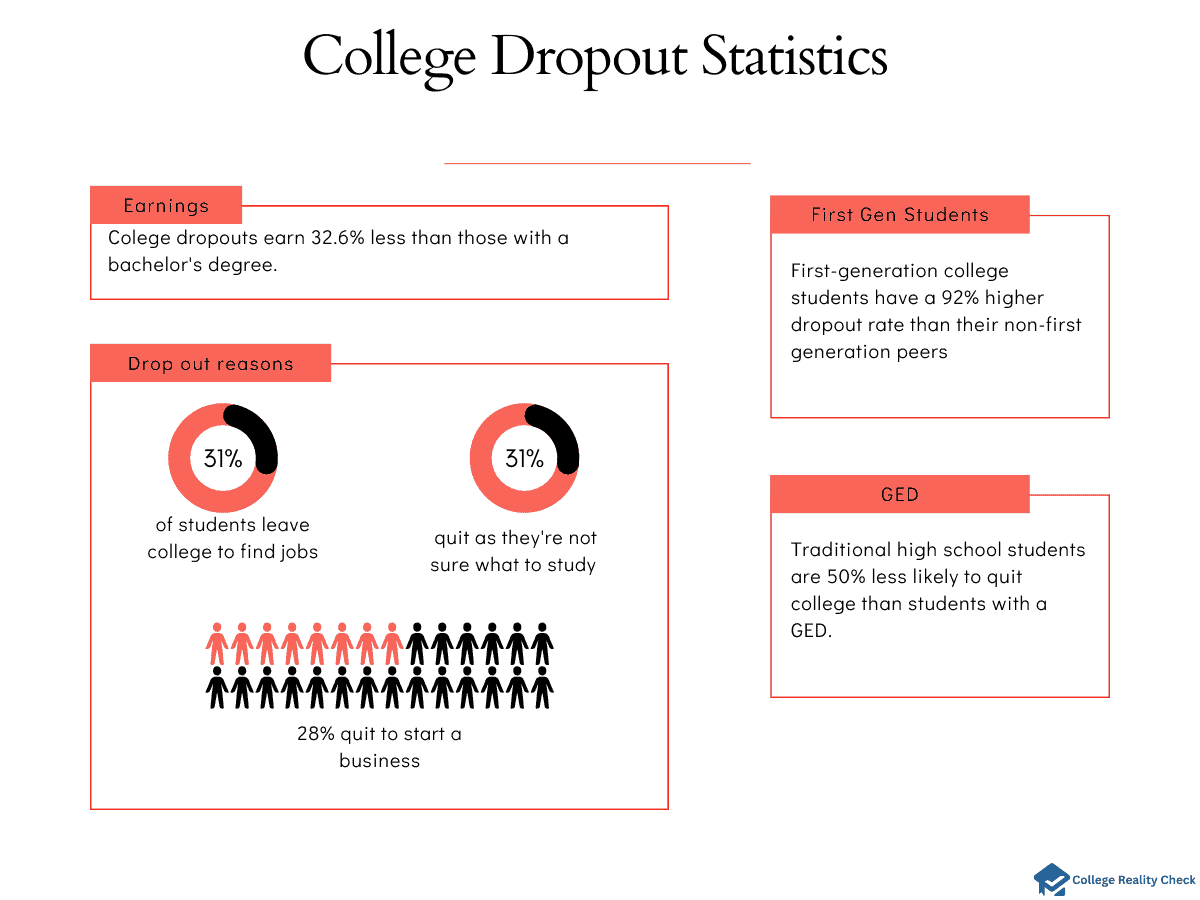
- The dropout rate for all undergrads, says the same source, is higher than first-time degree-seekers — 40% vs. 26%.
- What’s the future like for college dropouts?
The Education Data Initiative says that individuals who leave college before earning their undergraduate degrees make, on average, 32.6% less income than those with a bachelor’s degree.
In addition, 19.6% of all college dropouts are more likely to be jobless than any degree holder.
- It says, too, that first-generation college students have a 92% higher dropout rate than their peers whose parents earned a bachelor’s degree or a higher educational attainment.
- Meanwhile, traditional high school students are 50% less likely to quit college than students with a GED.
- What about dropout rates in relation to ethnicity or race?
American Indians and Alaska Natives have a 45% dropout rate. Meanwhile, the dropout rate for Asian students is 19%.
White college students are almost 8% less likely to quit college before graduating. In contrast, Black college students are almost 34% more likely to drop out than the rest.
Up to 21% of Hispanic college students drop out of school, while 24% of multiracial students do so.
- There are more college dropouts in California than in any other state, with the number of students who stopped going to college amounting to 6,360,375.
On the other hand, relative to the total population, Oregon is the state with the highest rate of college dropouts: 18.2%.
The state with the highest dropout-to-undergraduate ratio is Alaska, which is 5:1.
- According to Forbes data 13% of college dropouts re-enroll within 5 years, usually at community colleges.
- The World Economic Forum says that 31% of students leave college to find jobs. Coincidentally, 31% of college dropouts say they quit as they’re not sure what to study.
On the other hand, 28% of them do so to start a business.
- Meanwhile, Fox Business says that about 2 in 5 college dropouts cite financial reasons for quitting school.
Adults Returning to College Statistics
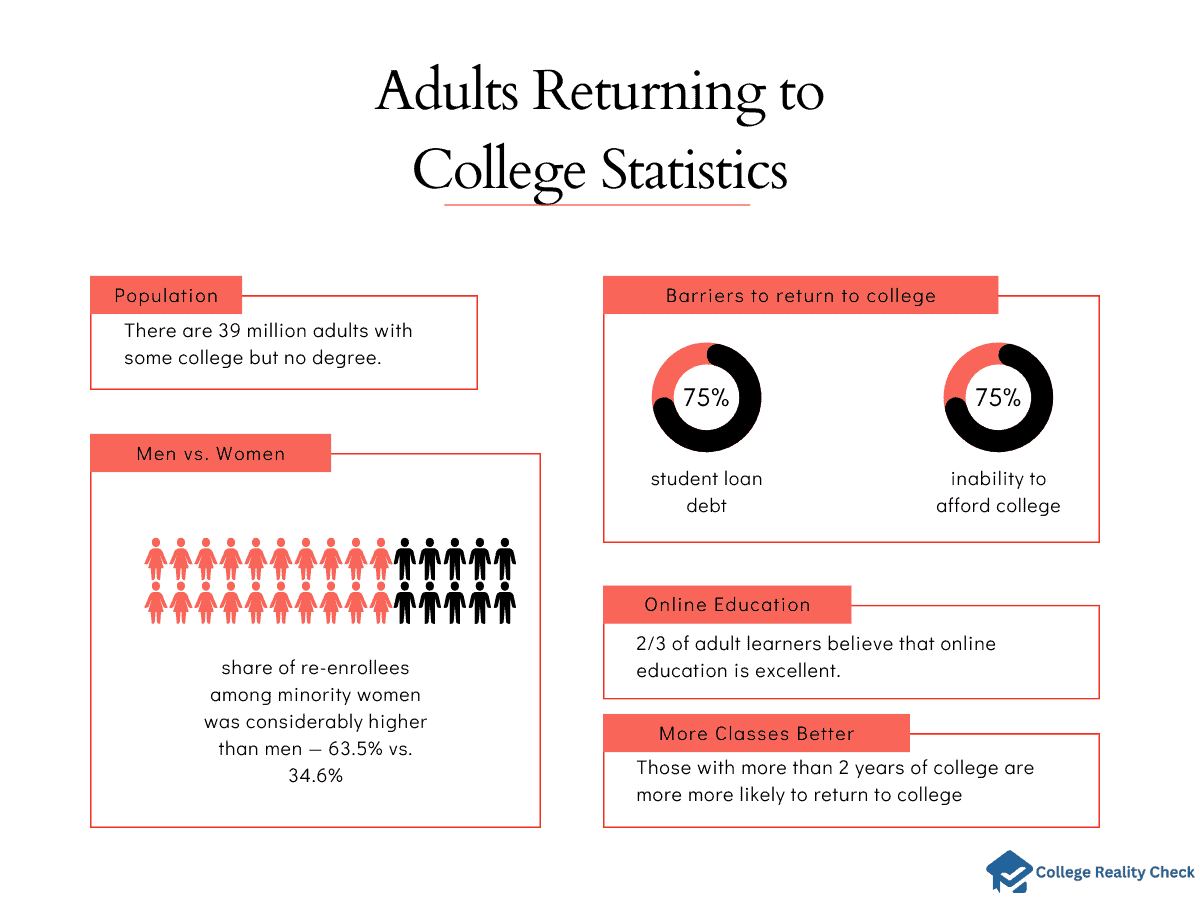
In the US, there are over 39 million adults with some college but no degree.
For those who are a part of the statistics, returning to college to finish what they once started is easier said than done.
There are simply a lot of things to consider when planning on completing a college degree program, from the cost of attendance to balancing their studies with their work or children.
- Based on the Adult Viewpoints: Online Learning and the Back-to-School Decision Survey conducted by Full Circle Research, as reported by Business Wire, 6 out of 10 American adults who never went to college or went to college but never finished consider going back to school to earn a certificate, associate degree or a bachelor’s degree.
- However, certain things are keeping them from doing so. And the 2 main barriers are being burdened with student loan debt (cited by 75% of respondents) and inability to afford college (cited by 70% of respondents).
- The same report said that almost two-thirds of surveyed adult learners believe that online education is excellent.
- As a matter of fact, 38% of them believe that online learning is better than face-to-face learning, while only 26% of them agree that traditional learning is better than its online counterpart.
- Meanwhile, Ruffalo Noel Levitz or RNL reports, based on the study Some College, No Degree: A 2019 Snapshot for the Nation and 50 States by the National Student Clearinghouse:
- around 29% of American adults with some college but no credential enrolled for a single semester only
- 61% enrolled for more than 1 semester but less than 2 years.
- It also says that those with more than 2 years of college are not only more significantly more likely to return to college than their peers but also are very much likely to finish.
- Straight from the post of the National Student Clearinghouse itself, there are more women who return to college and also persevere and earn a certificate or degree than men.
In addition, the share of re-enrollees among minority women was considerably higher than men — 63.5% vs. 34.6%.
Student Pregnancy in College Statistics
College students are at their optimal reproductive age, and can choose from among completing their college degrees, establishing a career, bearing a child and getting married, among other things.
As such, many of them are torn between paving a career path through education or starting a family.
Unwanted pregnancies are also a common issue among college students.
- According to a blog hosted by the University of Oregon, about 50% of college students have unexpected pregnancies, which means they do not have any plans of becoming pregnant as they work on a college degree.
- On the other hand, a study published by Virginia Tech says that 12% of college students experience or get involved in unplanned pregnancy, which isn’t surprising given that the majority of college students these days engage in sexual intercourse, generally with different partners, and many do not use contraception.
- However, other experts mentioned in the same study said that the number may be closer to 23%.
- Meanwhile, in Latin America, as per study the Development Bank of Latin America published, as much as 36% of all dropout cases in the region can be attributed to either teen pregnancy or motherhood.
- In mainland China, on the other hand, 14.9% of female college students become unintentionally pregnant, while 19.5% of male college students admit to getting their partners pregnant unintentionally.
Student Parents in College Statistics
College students are at their reproductive age.
And that is why it doesn’t come as a surprise that some of them end up as parents — some are planned and others are unplanned, while some of them continue to pursue their academic goals and others drop out of college.
But then there are also parents who return to college to earn qualifications.
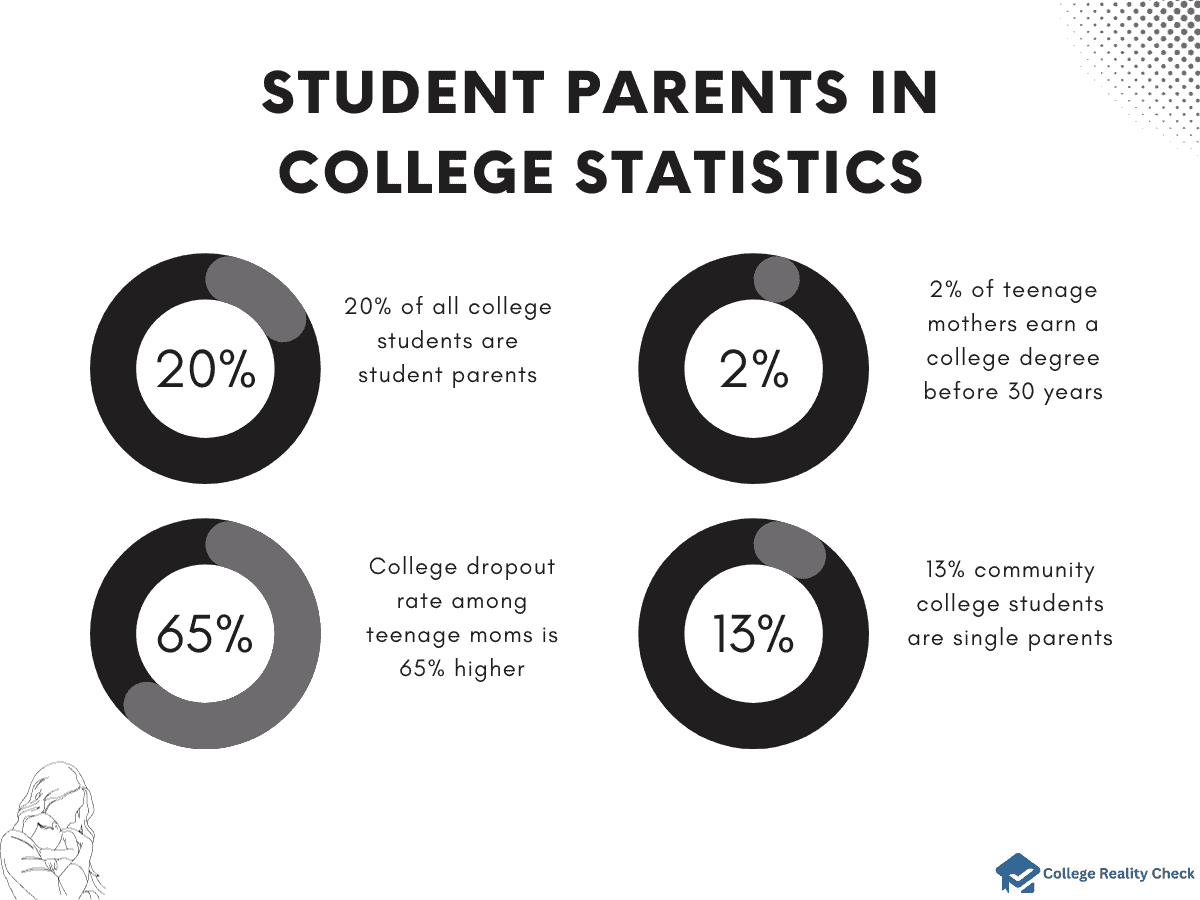
- It is estimated that more than 20% of all college students are student parents.
- Similarly, the same source says that student parents in college are also more likely to be students of color than students without kids — about one-third of student parents are Blacks and more than one-fifth are Latinos.
- Gitnux, meanwhile, says that almost 22% of community college students are parents and 13% are single parents.
- Based on a published manuscript by the National Library of Medicine, only 2% of teenage mothers earn a college degree before 30 years of age, compared to the 9% of mothers who delayed having a baby until the age of 20 or 21 as well as approximately 35% of all women in the US overall.
- On the other hand, it states, the college dropout rate among teenage moms is 65% higher than female students who didn’t give birth — it adds, too, that some estimate that less than 2% of teenage mothers graduate.
- The National Conference of State Legislatures, as reported by Best Colleges, says that, in 2013, young women who gave birth while attending community colleges were 65% less likely to earn their associate degrees.
College Campus Violence Statistics
Violence and crime on college campuses, unfortunately, are not uncommon.
Some of the reasons for the high rates of violence and crime at colleges and universities across the US include the presence of alcohol and drugs, financial constraints and mental health issues.
The effects on victims can range from trauma to poor academic performance and from injuries to death.
- According to a report by the National Center for Education Statistics, a total of 21,200 criminal incidents of various types on college campuses in the US were reported in 2020.
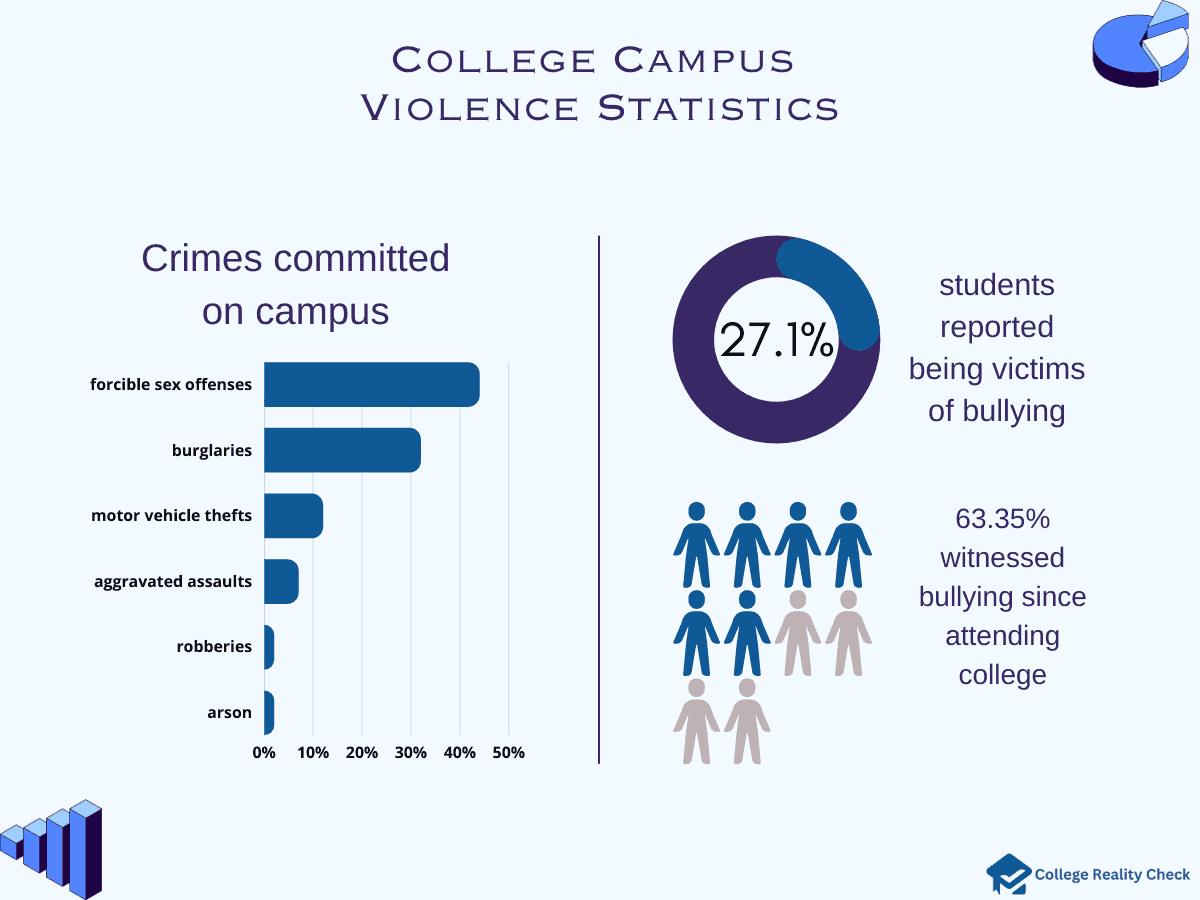
- The following are the types of on-campus crimes committed and the percentages or reports:
- forcible sex offenses (44%)
- burglaries (32%)
- motor vehicle thefts (12%)
- aggravated assaults (7%)
- robberies (2%)
- arson (2%)
- Between 2010 and 2019, the same report says that the overall number of reported on-campus crimes decreased by 15%, from 32,100 to 21,200 incidents.
On the other hand, between 2019 and 2020, the cases dropped by up to 22%, from 27,200 to 21,200 on-campus crimes reported.
- Crimes and violence can be school-related but may not necessarily happen on school grounds.
For instance, says the US Department of Education, around 503,000 students experienced school-associated violence off campus back in 2017.
- UNESCO says, meanwhile, that bullying is the most common type of crime committed in schools all over the planet.
According to the Journal of Bullying and Social Aggression, 27.15% of surveyed college students reported being victims of bullying.
Meanwhile, 63.35% witnessed bullying since attending college.
College Drinking Statistics
Drinking is common among college students.
As a matter of fact, according to an article published by BMC Public Health, excessive alcohol intake is quite common among them.
There are different reasons why college students drink, and some of them include experimentation, stress and anxiety relief, socializing, peer pressure and the desire to fit in.
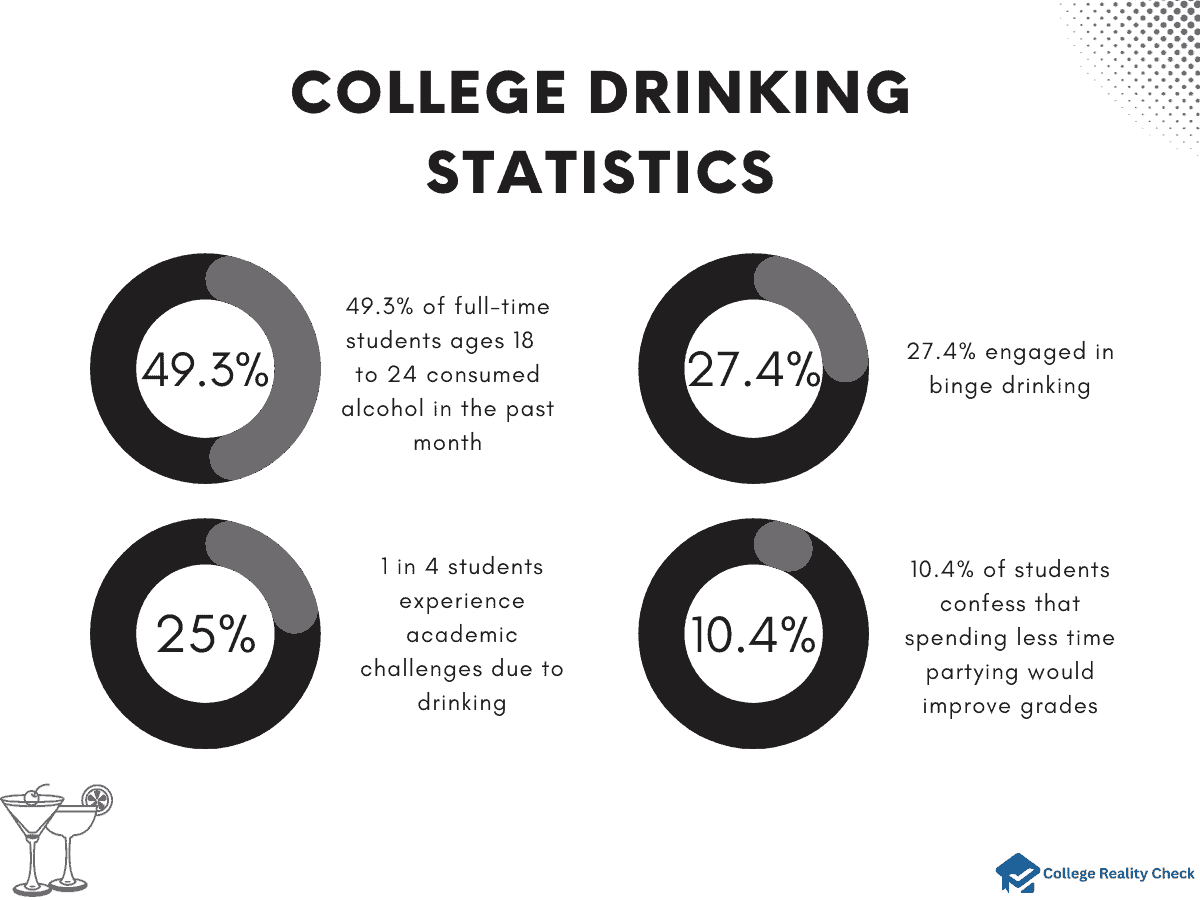
- A post by the National Institute on Alcohol Abuse and Alcoholism says that 49.3% of college students ages 18 to 22 and enrolled full-time consumed alcohol in the past month.
- Of those during the said time frame, 27.4% engaged in binge drinking.
- The said post adds that about 1 in 4 college students report experiencing academic challenges due to drinking.
- What’s more, college students who binge drank alcohol at least 3 times per week were about 6 times more likely to perform badly on a test or project as a result of drinking than students who drank but never binged — 40% vs. 7%.
- According to a survey done by FileMaker, Inc., even though 74% of college students actually spend less than 20% of their free time partying, around 48% of them agree that going to parties affects their grades.
- As a matter of fact, the same survey found that 10.4% of college students confess that spending less time partying and socializing would get them better grades.
College Students DUI Statistics
There are different reasons why college students drink alcohol — with an average of 3 episodes of abusive consumption per month, says a BMC Public Health post.
Some, for instance, do it for fun, while others do so to relieve stress. As such, DUI is among the most common and most serious alcohol-related issues among college students in the US.
- A journal the National Library of Medicine published says that 16% to 30% of college students in the US admit to driving after consuming alcohol, which makes them as well as others susceptible to serious potential consequences.
- As a matter of fact, the post adds that about 49% of traffic deaths among students are related to alcohol.
- Believe it or not, according to Catalyst, which is a publication of the Higher Education Center for Alcohol, Drug Abuse and Violence Prevention by the US Department of Education, students at certain colleges were more likely to drink and drive.
For instance, reports of driving after drinking alcohol are higher at large campuses.
- On the other hand, the rates of drinking after having alcohol are lower at colleges in the Northeast.
- Living setups also have an impact on DUI incidents.
Based on the same publication, a smaller percentage of college students who live in dormitories report drinking and driving or riding with a drunk driver than college students who live in Greek houses.
- Not surprisingly, residents of substance-free halls report the lowest rates of drinking and driving.
- Among college students who reside off campus, those who live with their parents, of course, have lower rates of drinking and driving compared to those who lived alone or shared an apartment with another student.
College Student Vehicle Ownership Statistics
Many college students don’t need cars.
This is especially true for those whose homes are simply too far away to drive to when school breaks come as well as for those who have no reason to leave the campus.
Besides, things like campus shuttles, bike sharing and rise sharing have made transportation better for most degree-seeking students.
- Based on a survey conducted by ValuePenguin, around 56% of college students in the US have a vehicle with them while completing their respective degree programs.
- It adds that students attending colleges and universities in the South are most likely to have a car — all 66% of them.
On the other hand, those who are going to school in the Northeast are the least likely to own a car (40%).
For most students with vehicles (77%), the ones they are driving are used.
- Only 19% of car-owning college students have vehicle models from 2017 to 2019 — 16% are driving 2011 to 2013 models, while 20% are driving 2009 models or even older models
- The same ValuePenguin survey says that 16% of college students with vehicles own Toyotas, while 16% are driving Hondas.
Meanwhile, 10% of them are driving Chevrolets, and another 10% are driving Fords.
And when it comes to dream cars, 15% said Tesla, while 7% said Honda and 6% said BMW.
- So, how did college students get their vehicles?
- 25% of surveyed ones said it was bought to them by their parents, but not as gifts
- 22% of college students saved money and paid for their cars themselves
- 21% of car owners said their cars were a hand-me-down from a family member
Food Insecurity in College Students Statistics
Food insecurity is the lack of consistent access to enough food to live an active, healthy life.
Such is a result of poverty, low income and unemployment. A lack of affordable housing and chronic health conditions are causes, too.
In the US alone, over 34 million, including 9 million children, experience food insecurity. College students are some of them, too.
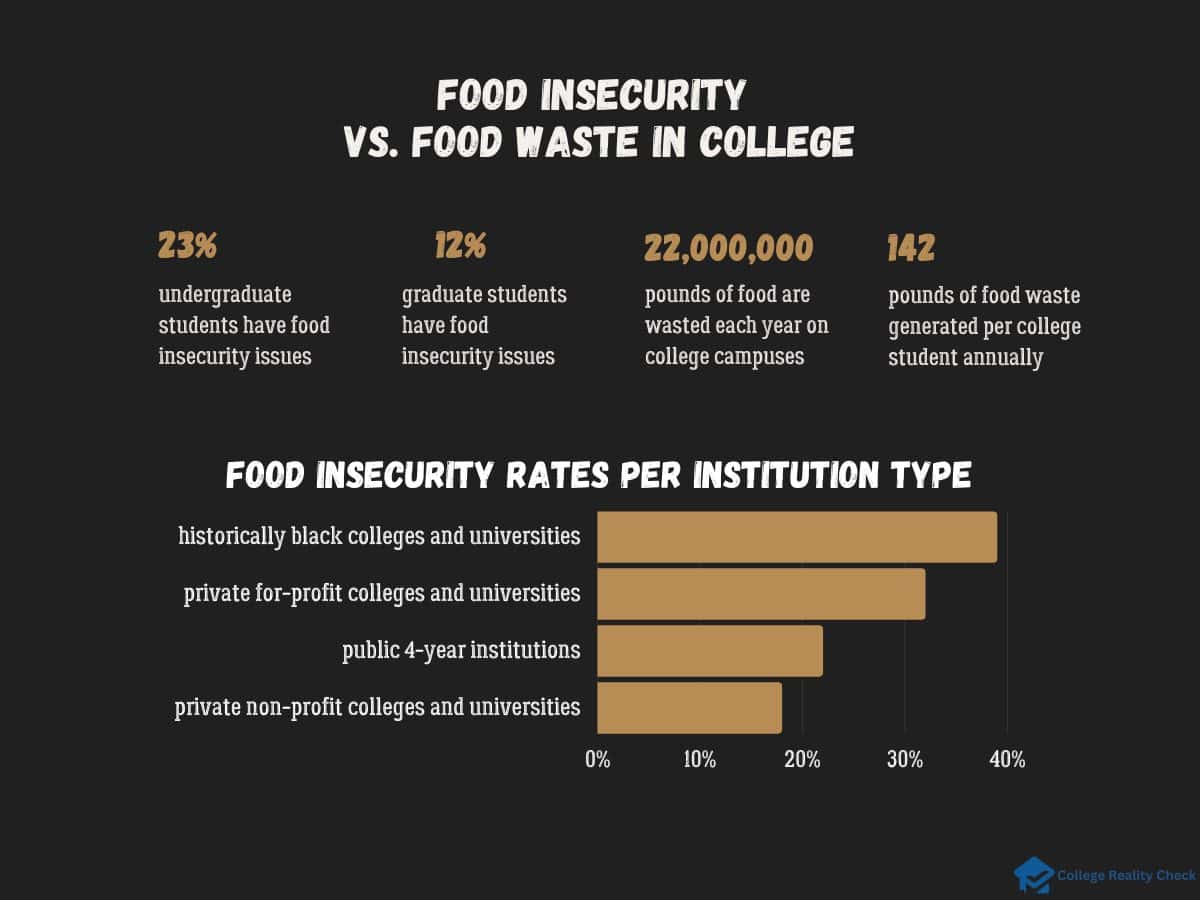
- According to a report by the National Center on Safe Supportive Learning Environments, it is estimated that 1 in every 3 college students across the US experiences food insecurity.
- Data from the National Postsecondary Student Aid Study, as posted by Diverse, says that 23% of undergraduate students and 12% of graduate students have food insecurity issues.
According to the Economic Research Service by the USDA, these rates are higher than those among the public in general (10.2%).
- The same Diverse post reveals the following food insecurity rates per institution type:
- historically black colleges and universities (39%)
- private for-profit colleges and universities (32%)
- public 4-year institutions (22%)
- private non-profit colleges and universities (18%)
- And in terms of race or ethnicity, here are the numbers among college students in the US:
- Blacks (35%)
- Native Americans (30%)
- Hispanics (25%)
- Asians (18%)
- Whites (18%)
College Food Waste Statistics
Every year in the US, almost 40% of food goes to waste, says the Menus of Change University Research Collaborative, which is a network of colleges and universities in the nation that study campus dining halls for behavior change.
Young adults, such as those in their college-going age, are susceptible to a lot of things, including contributing to food wastage.
- Higher Ed Dive says that around 22 million pounds of food are wasted each year on college campuses.
- It adds that the average college student generates approximately 142 pounds of food waste annually.
- Stone Pier Press reports that Georgia Tech tackles food wastage through awareness, while Middlebury College resorts to composting.
Meanwhile, UC Berkeley has pantries that provide leftover food to students who are facing food insecurity, while the University of Michigan has removed food trays to keep students from taking more food than they can eat.
- Based on a report by The Emily Program, one study reports that, among college students, 13.5% of women and 3.6% of men exhibited eating disorder symptoms.
Meanwhile, a different study says that 4 out of 10 students have either experienced an eating disorder themselves or know someone who has.
Obesity in College Students Statistics
Some college students are obese, while others are overweight.
Obesity is a disease characterized by an excessive deposition of fat and a body mass index or BMI of more than 30 (normal BMI is from 18.5 to 24.9).
On the other hand, being overweight means having more body weight than normal for one’s age or build — a person can be overweight and still not obese.
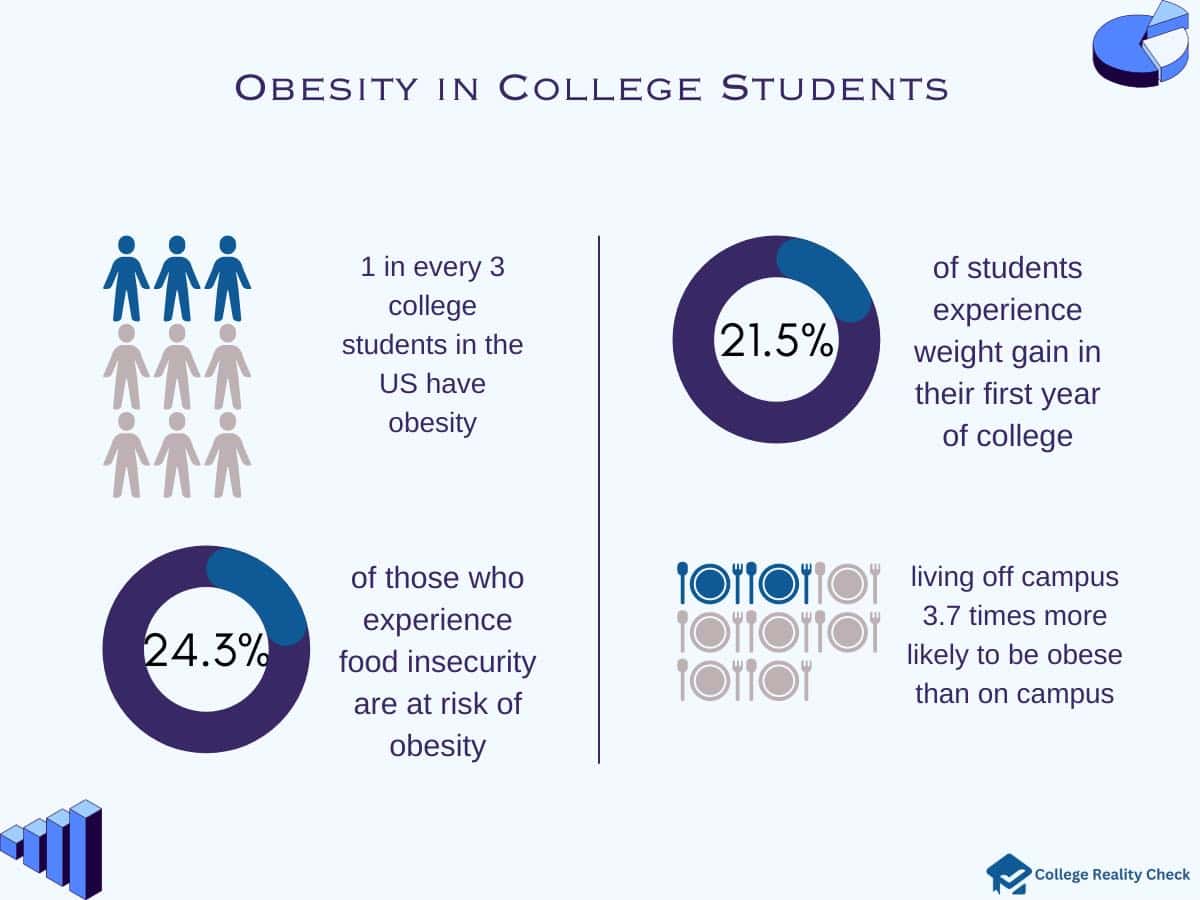
- According to a post by the Obesity Medicine Association, almost 1 in every 3 college students in the US have obesity.
- It adds that around 44% of all college students in the country describe their weight as more than being normal, which means that they feel they are either overweight or obese.
- Based on the same post, there are 2 main causes of obesity among American college students: poor food choices and large meal portions.
This is especially true since many students become responsible for shopping for groceries and preparing their own food for the first time in their lives as a result of moving away from their respective homes.
- Leading a stressful life contributes to unhealthy eating and excessive snacking, which can lead to obesity.
- On the other hand, a report by Gitnux says that 21.5% of college students in the US experience weight gain in their first year of college, while more than 25% of freshmen students gain an average of 12.2 pounds in 1 year.
- How often do they eat fast food? The same report says around 1.33 times per week.
- Intriguingly, compared to students who live on campus, those who live off campus are up to 3.7 times more likely to be obese. What’s more, approximately 24.3% of those who experience food insecurity are at higher risk of obesity.
College Students Smoking and Vaping Statistics
Smoking is done by college students for different reasons.
For instance, many of them smoke to reduce stress and anxiety caused by their studies and family problems, too. Others do so to meet social needs, either to look trendy or out of peer pressure.
According to studies, college students with depression are more likely to smoke and have a harder time quitting.
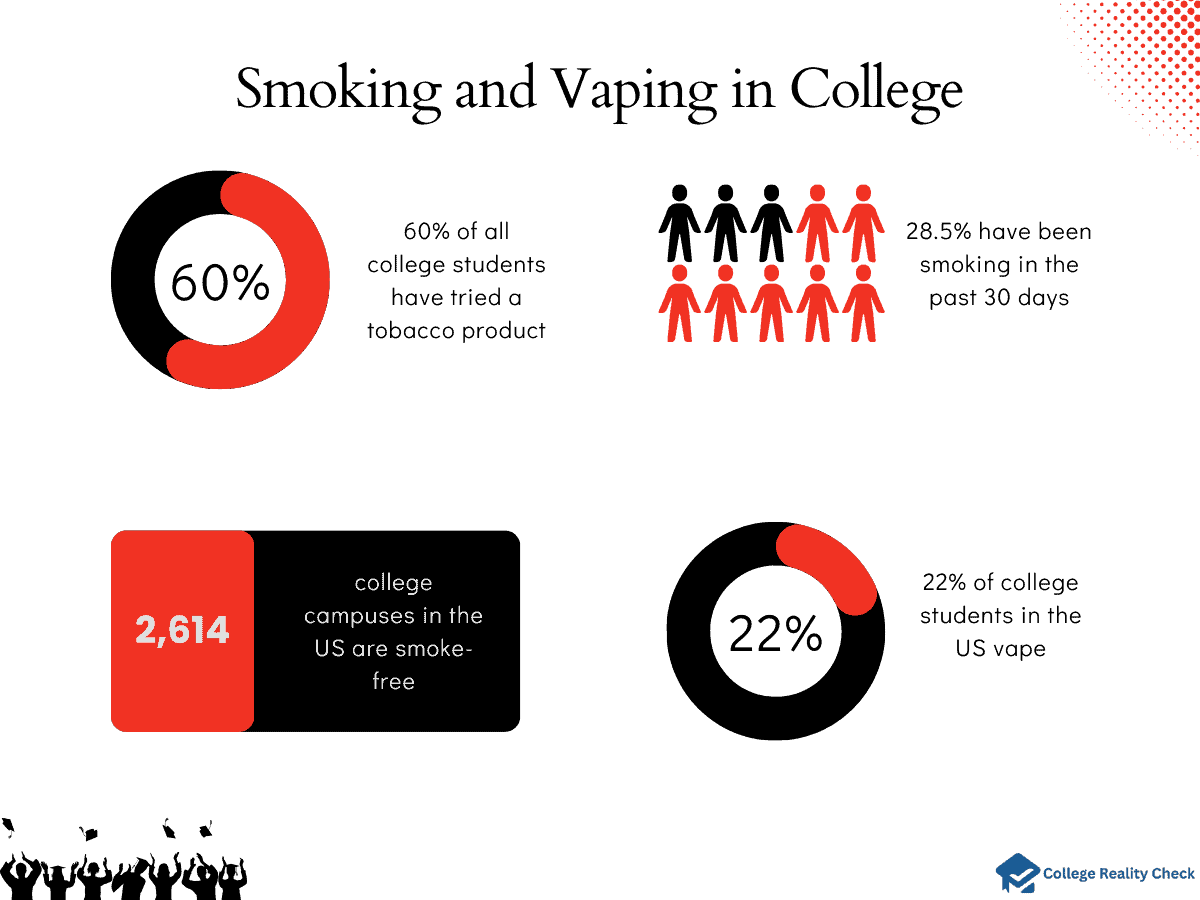
- A study reported by JAMA Network says that over 60% of all college students have tried a tobacco product. Among all tobacco use, cigarette smoking accounts for the majority.
- It adds that 53.4% of college students have smoked a cigarette, and around 38.1% of them have done so in the past year. Meanwhile, 28.5% have been smoking in the past 30 days.
- Among current smokers, the study indicates, 32.0% smoke less than 1 cigarette stick per day, while 43.6% smoke 1 to 10 cigarette sticks per day. Only 12.8% of current college smokers smoke 1 or more packs of cigarettes per day.
- An Inside Higher Ed post mentioned that 22% of college students in the US vape.
- According to the American Nonsmokers’ Rights Foundation, at least 2,614 college campuses in the US are smoke-free.
- Of those, 2,191 are tobacco-free by 100%. On the other hand, 2,274 prohibit vaping, while 1,246 ban hookah use. Marijuana smoking or vaping is banned in 603 campuses.
College Student Death Statistics
College prepares students for their chosen career paths.
In the process, postsecondary education also gives them all kinds of exciting and rewarding experiences, including those that only being on a college campus can offer.
However, there are also various types of risks, including those that could rob them of the opportunity to become degree holders, such as death.
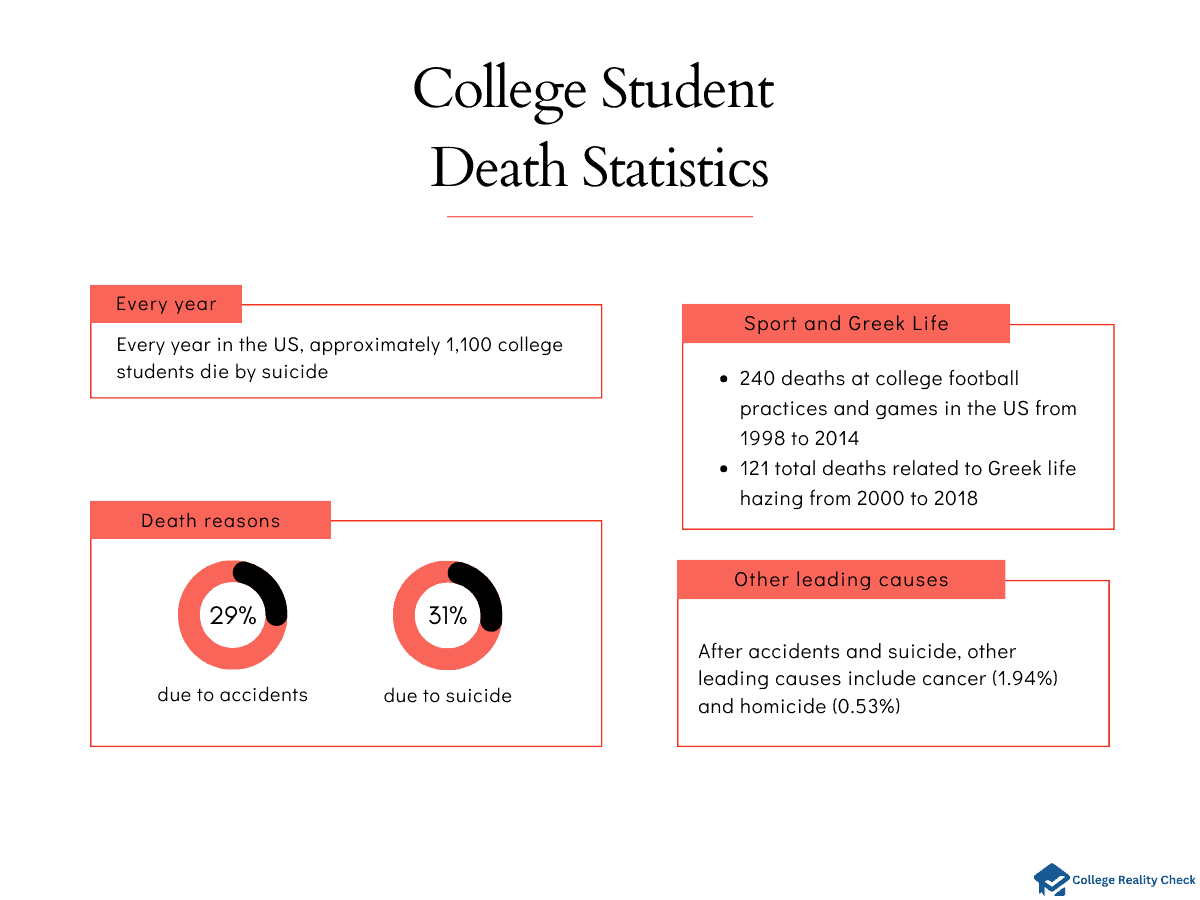
- Around 29% of college deaths are due to accidents, while 22% are due to suicide, Gitnux says.
- It adds that every year in the US, approximately 1,100 college students die by suicide, which makes it the second leading cause among individuals in the age group.
- What’s the leading cause of death among US college students?
Vehicular accident, says the study published by the National Library of Medicine, Causes of Mortality Among American College Students: A Pilot Study.
After vehicular accidents and suicide, other leading causes include cancer (1.94%) and homicide (0.53%).
- Going back to the Gitnux report, it says that there were a total of 240 deaths at college football practices and games in the US from 1998 to 2014.
- Meanwhile, from 2000 to 2018, there were 121 total deaths related to Greek life hazing.
References:
- Saffier, R., Harrison, A. (2023, September 7). Student loan debt: Averages and other statistics in 2023. USA Today.
- Ma, J., Pender, M. (2022). Trends in College Pricing and Student Aid 2022. Trends in Higher Education Series.
- (n.d.). Women & Student Debt. American Association of University Women.
- Hanson, M. (2023, August 13). Women & Student Debt. Education Data Initiative.
- Hanson, M. (2023, April 26). Average Cost of College by State. Education Data Initiative.
- Bouchrika, I. (2023, June 20). 66 Free College Education Statistics: 2023 Data, Trends & Predictions.
- (2015, November). Education and Lifetime Earnings. Social Security: Research, Statistics & Policy Analysis.
- Carnevale, A., Rose, S., Cheah, B. (2011). The College Payoff: Education, Occupations, Lifetime Earnings. Center on Education and the Workforce.
- Smith, M. (2023, May 16). These are the Highest-Paying College Majors, 4 Years After Graduation — Many Pay Over $100,000.
- (2023, May 3). What is a Good High School GPA for Top US Colleges? Crimson.
- (n.d.). Enrollment. National Center for Education Statistics.
- (n.d.). College Enrollment Rates. National Center for Education Statistics.
- (n.d.). 2024 Hardest Colleges to Get Into in America. Niche.
- Clinedinst, M. (2019). 2019 State of College Admission. National Association for College Admission Counseling.
- Moody, J. (2021, April 20). 10 Universities Where It’s Hard to Get Off the Waitlist. US News.
- (2017). The Class of 2017 Student Survey Report. National Association of Colleges and Employers.
- (2020). The 2020 Student Survey Report: Attitudes, Preferences and Outcomes of Bachelor’s Degree Students at Four-Year Schools. National Association of Colleges and Employers.
- Gray, K., Collins, M. (2023, January 19). Use of Career Center Tied to More Job Offers, More Paid Internships. National Association of Colleges and Employers.
- (2022, May). College Student Employment. National Center for Education Statistics.
- (2021, October 4). College Employment and Student Performance. Penn Wharton: Budget Model.
- Ali, S. (2022, April 27). Stress Driving College Students to Consider Withdrawing: Gallup. The Hill: Changing America.
- (2023, May 3). School Stress for College Students and Unhealthy Coping Mechanisms. American Addiction Centers.
- Abrams, Z. (2022, October 1). Student Mental Health is in Crisis. Campuses are Rethinking Their Approach. American Psychological Association.
- (2013, September 13). College Survey: NAMI Finds 64 Percent of College Students with Mental Health Problems Drop Out; 79 Percent Call for Faculty Training for Mental Health Awareness. CNBC.
- (2023, August 29). Primary Mental Health Issues Among US College Students 2022. Statista.
- Hershner, S., Chervin, R. (2014). Causes and Consequences of Sleepiness Among College Students. National Libraty of Medicine.
- (2021, May 28). Why You Should Make a Good Night’s Sleep a Priority. Harvard Summer School.
- Kaplan, J. (n.d.). Ranked: The Most Sleep-Deprived College Majors in America. The Tab.
- (n.d.). Statistics on Cheating. The University of Alabama: College of Arts & Sciences.
- (n.d.). 8 Astonishing Stats on Academic Cheating. Open Education Database.
- (n.d.). Academic Dishonesty Statistics. ProctorEdu.
- (n.d.). Where Has the Time Gone? College Success Plan.
- (n.d.). College Students Struggle With Organizational Skills. Reliable Plant.
- Maffett, S. (n.d.). Time Management. Piedmont Technical College: College Resources.
- (2015, October 1). Leaving Essays to the Last Minute Can Ruin Your Grades. Warwick Business School: The University of Warwick.
- Shatz, I. (n.d.). Procrastination Statistics: Interesting and Useful Statistics about Procrastination. Solving Procrastination.
- Zedd, E. (2023, March 3). Opinion: Social Media Has Turned College Students Into Mass Consumers. The Breeze.
- Auxier, B., Anderson, M. (2021, April 7). Social Media Use in 2021. Pew Research Center.
- Nagel, T. et al. (2018). Findings on Student Use of Social Media at the Collegiate, Undergraduate, and Graduate Levels: Implications for Post-Secondary Educators. Journal of University Teaching & Learning Practice, 15(1).
- Zauderer, S. (2023, September 15). 121 Social Media Addiction Statistics Worldwide. Cross River Therapy.
- (2009, December 23). Student Grades Not Affected by Social Networking. News Wise.
- (n.d.). The Most Surprising College Relationships Statistics And Trends in 2023. Gitnux.
- Maximets, N. (2022, March 21). How Many College Relationships Last? | Latest Statistics and Facts. Online Divorce.
- Beckmeyer, J. et al. (2021). Long-Distance Romantic Relationships Among College Students: Prevalence, Correlates, and Dynamics in a Campus Probability Survey. National Library of Medicine.
- Hanson, M. (2023, September 6). Average Cost of College & Tuition. Education Data Initiative.
- Bouchrika, I. (n.d.). 82 Student Housing Statistics: 2023 Data, Insights & Predictions.
- Cushnahan, M. (2022, November 15). The Student Beans US Housing Insecurity Report. Student Beans Blog.
- Renfrow, J. (n.d.). Greek Life is a Hard No. The Horizon.
- Abbot, G. (2023, April 28). What Percentage of College Students Are in Greek Life? Classrooms.
- (n.d.). Hazing Statistics. University of Maryland: Stop Hazing @ UMD.
- (2017). Data Point: Beginning College Students Who Change Their Majors Within 3 Years of Enrollment. National Center for Education Statistics.
- (2019, October 14). New Survey: Student Confusion Selecting Majors Increases Higher Education Cost and Time to Earn Degree. Business Wire.
- Hanson, M. (2023, July 17). College Dropout Rates. Education Data Initiative.
- Bouchrika, I. (n.d.). College Dropout Rates: 2023 Statistics by Race, Gender & Income.
- Copper, P. (2019, November 5). How Many College Dropouts Go Back To School? Forbes.
- Masterson, V. (2022, September 6). More Students are Dropping Out of College in the US – Here’s Why. World Economic Forum.
- Giovanetti, E. (n.d.). Money is the Top Reason Why Students are Dropping Out of College, Study Finds. Fox Business.
- (2022, May 10). More Than 39 Million Americans Have Some College, No Credential, According to New Research. National Student Clearinghouse.
- (2018, January 23). Survey Reveals 60 Percent of U.S. Adults Have Considered Returning to School, But Perceived Financial Barriers Loom Large. Business Wire.
- Jeffe, S. (2019, December 16). Adults Returning to College: More Than 3 Million Are Ready to Finish. Ruffalo Noel Levitz (RNL).
- Wendi, A. (1999, April 13). The Effects of Unplanned Pregnancy Among College Women. Virginia Tech.
- Miquilena, M., Lara, E. (2021, January 18). Teen Pregnancy as a Cause of School Dropout. Development Bank of Latin America.
- Yuan, Y. et al. (2022, February 19). Prevalence of and factors associated with unintended pregnancies among sexually active undergraduates in mainland China. BMC.
- Williams, B. (2022, August 9). Many Determined College Students Are Also Dedicated Parents: A Preview of the Student Parent Affordability Report. The Education Trust.
- (n.d.). The Most Surprising Community College Students Statistics And Trends in 2023. Gitnux.
- Cone, J. (2022). Socioeconomic Well-Being in Early Adulthood Among Repeat Versus One-Time Teenage Mothers. National Library of Medicine.
- Bryant, J. (2023, January 11). Pregnant in College: What You Need to Know. BestColleges.
- (n.d.). College Crime. National Center for Education Statistics.
- (n.d.). Harmful and Underage College Drinking. National Institute on Alcohol Abuse and Alcoholism.
- (n.d.). College Students Struggle With Organizational Skills. Reliable Plant.
- LaBrie, J. et al. (2012). Predicting Driving After Drinking Over Time Among College Students: The Emerging Role of Injunctive Normative Perceptions. National Library of Medicine.
- (2011). Catalyst. Higher Education Center for Alcohol, Drug Abuse and Violence Prevention, 12(1).
- Black, M. (2022, September 19). College Students Drive Toyotas and Hondas but Dream of Teslas. Value Penguin.
- (2023, February 13). One in three students experience food insecurity nationwide. With state funding, local universities are ramping up efforts to tackle it. National Center on Safe Supportive Learning Environments.
- Edelman, J. (2023, August 4). Government Data Reveals 1 in 5 Undergrads Are Food Insecure. Diverse.
- (n.d.). Food Security and Nutrition Assistance. USDA.
- (n.d.). Food Waste Research in College and University Settings: An Overview. Menus of Change University Research Collaborative.
- Donachie, P. (2017, November 20). Colleges Combat Food Waste Through Innovation, Dedicated Buy-In. Higher Ed Dive.
- Hutchinson, H. (n.d.). Tackling Food Waste on College Campuses. Stone Pier Press.
- (2023, July 24). Eating Disorders in College Students. The Emily Program.
- (2022, July 22). Obesity Care in College Students in the US. Obesity Medicine Association.
- Rigotti, N. et al. (2000, August 9). US College Students’ Use of Tobacco Products: Results of a National Survey. JAMA Network.
- Mowreader, A. (2023, July 28). How Colleges Are Discouraging Vaping Among Students. Inside Higher Ed.
- (2023). Smokefree and Tobacco-Free US and Tribal Colleges and Universities. American Nonsmokers’ Rights Foundation.
- (n.d.). College Student Death Statistics And Trends in 2023. Gitnux.
- Turner, J. (2013). Causes of Mortality Among American College Students: A Pilot Study. National Library of Medicine.